- Price has dropped down to $2.52.
- Fantom price analysis shows downtrend.
- Support for cryptocurrency is $1.81.
The one-day and four-hour Fantom price analysis confirms a declining trend for the day as the price has undergone a significant drop during the last 24-hours as the coin is correcting after spiking high yesterday. Although the bullish trend reached its peak in the previous week, today’s trend is relatively on the discouraging side. The price reduction has brought FTM/USD value down to $2.52 low, and further loss might be coming ahead.
FTM/USD 1-day price chart: Bearish return initiates price reduction up to $2.52
The last 24-hours have proved favorable for the bears as a considerable rise in the selling activity has been observed. A reversal in trends is to be expected in the next week, as the price has suddenly experienced a drop up to $2.52. The short-term trending line is still ascending as the previous week was relatively on the bullish side. The moving average (MA) value in the one-day price chart is at the $2.210 mark.
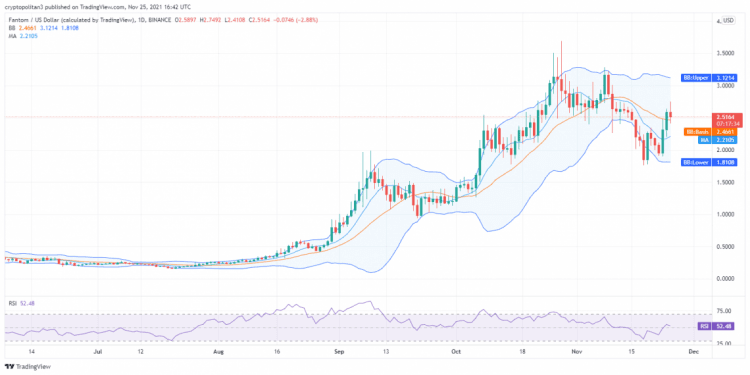
The Bollinger bands average has moved down to $2.47 during the day. Whereas the upper Bollinger band shows $3.12 of value and the lower Bollinger band shows $1.81 value. The Relative Strength Index (RSI) score has dropped to 52.48, which is quite a neutral figure.
Fantom price analysis: Bears drag down price below $2.51 after latest strike
The four hours Fantom price analysis confirms a bearish trend, as the past few hours have proved to be quite critical for the market value of FTM/USD. The price has dropped below $2.51 as the bears have constantly been struggling to regain the lead. The short-term trending line is now descending as the bearish momentum has been gaining strength for the past few hours. The price is now below its moving average value, which is $2.54.
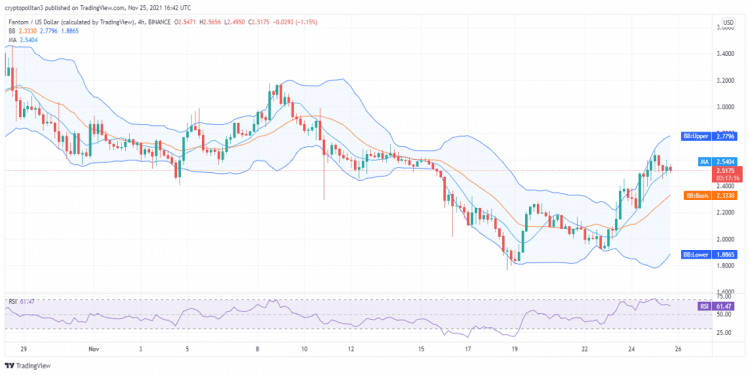
The Bollinger bands average has increased up to $2.33 in the past four hours as well. The upper Bollinger band value has shifted to $2.78, and the lower Bollinger band value is now $1.89. The RSI curve shows a downward movement, and the score has dropped down to 61.47 due to the downtrend.
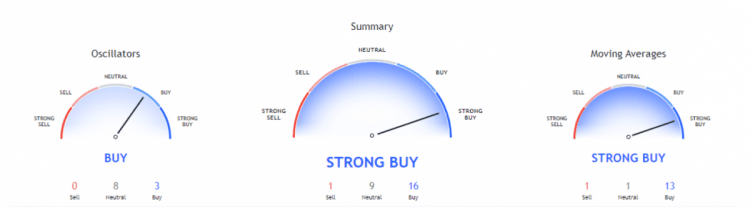
A substantial rise in FTM/USD value has been observed throughout the past few months. This is why the technical indicators chart gives out a strong bullish signal, which indicates an upward trend. There are 16 indicators present on the buying spot, nine hands are on the neutral spot, and one is on the selling spot.
The moving averages indicator shows a solid bullish trend as well. The indicators ratio can further confirm this as 13 hands are on buying point while one indicator is on the selling and neutral points. The oscillators display similar results with eight oscillators on the neutral level, three oscillators on buying level, and zero oscillators on the selling level.
Fantom price analysis conclusion
The one-day Fantom price analysis predicts a bearish trend for the day as the bearish momentum has been recovered in the past 24-hours. The price has leveled down to $2.52 as a result of the recent downtrend. The hourly price chart displays red candlesticks as well, which is a further indication of a downside. The bearish trend is expected to intensify in the next few days if the current trend continues.
Disclaimer. The information provided is not trading advice. Cryptopolitan.com holds no liability for any investments made based on the information provided on this page. We strongly recommend independent research and/or consultation with a qualified professional before making any investment decisions.