BeInCrypto takes a look at seven cryptocurrencies, including SHIBA INU (SHIB) which has reached a new all-time high, and 1inch (1INCH) which is very close to doing so.
BTC
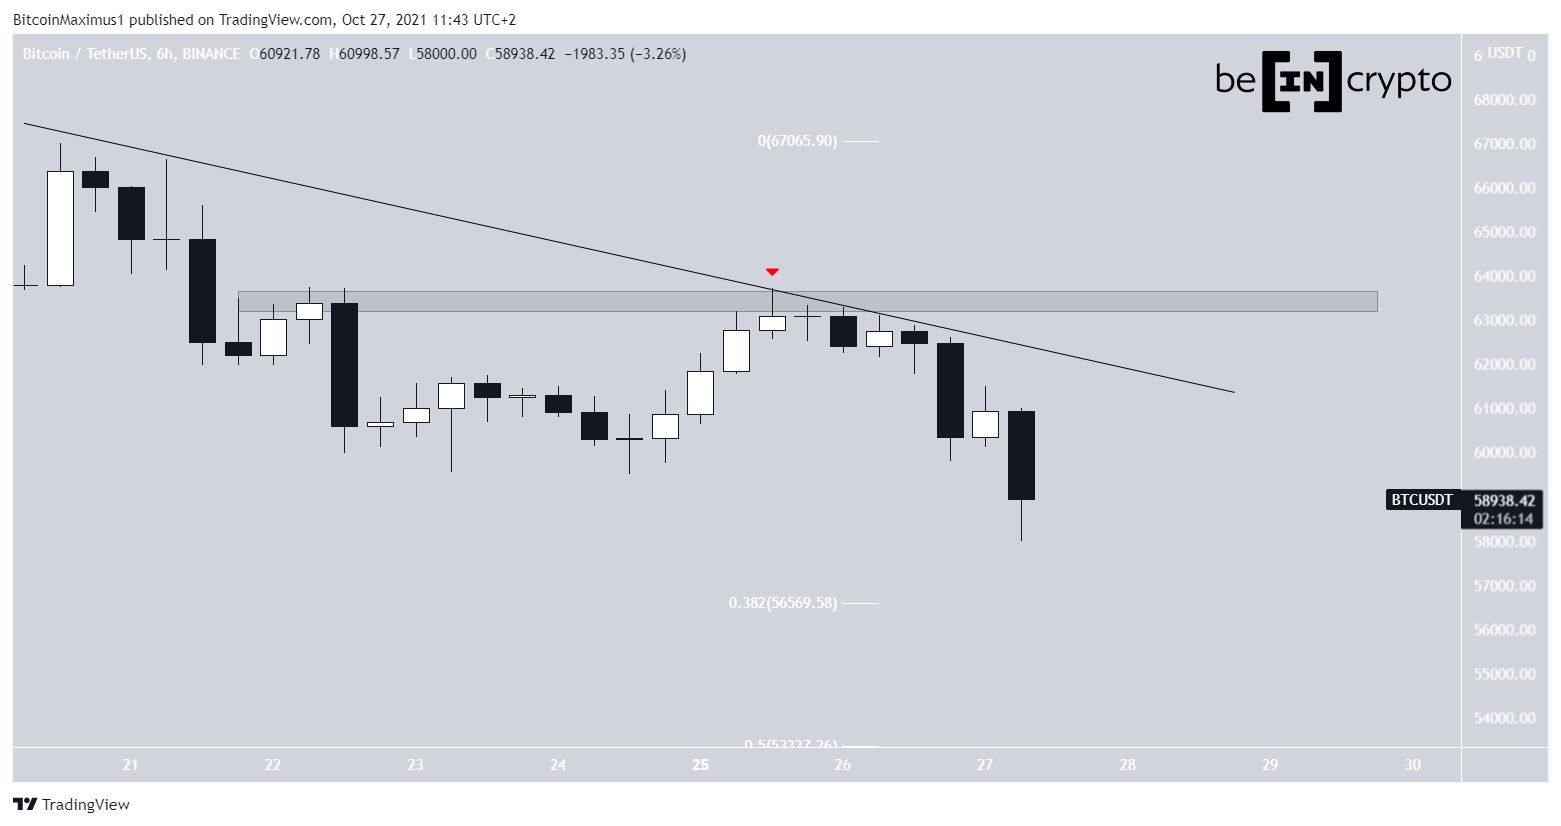
Bitcoin (BTC) has been decreasing since it reached an all-time high price on Oct 20.
On Oct 25, it was rejected by a descending resistance line in place since the all-time high (red icon). The line also coincided with the $63,500 horizontal resistance area.
As long as it is in place, the short-term trend is considered bullish.
However, BTC is approaching a strong support level at $56,500, which could initiate an upward movement.
ETH
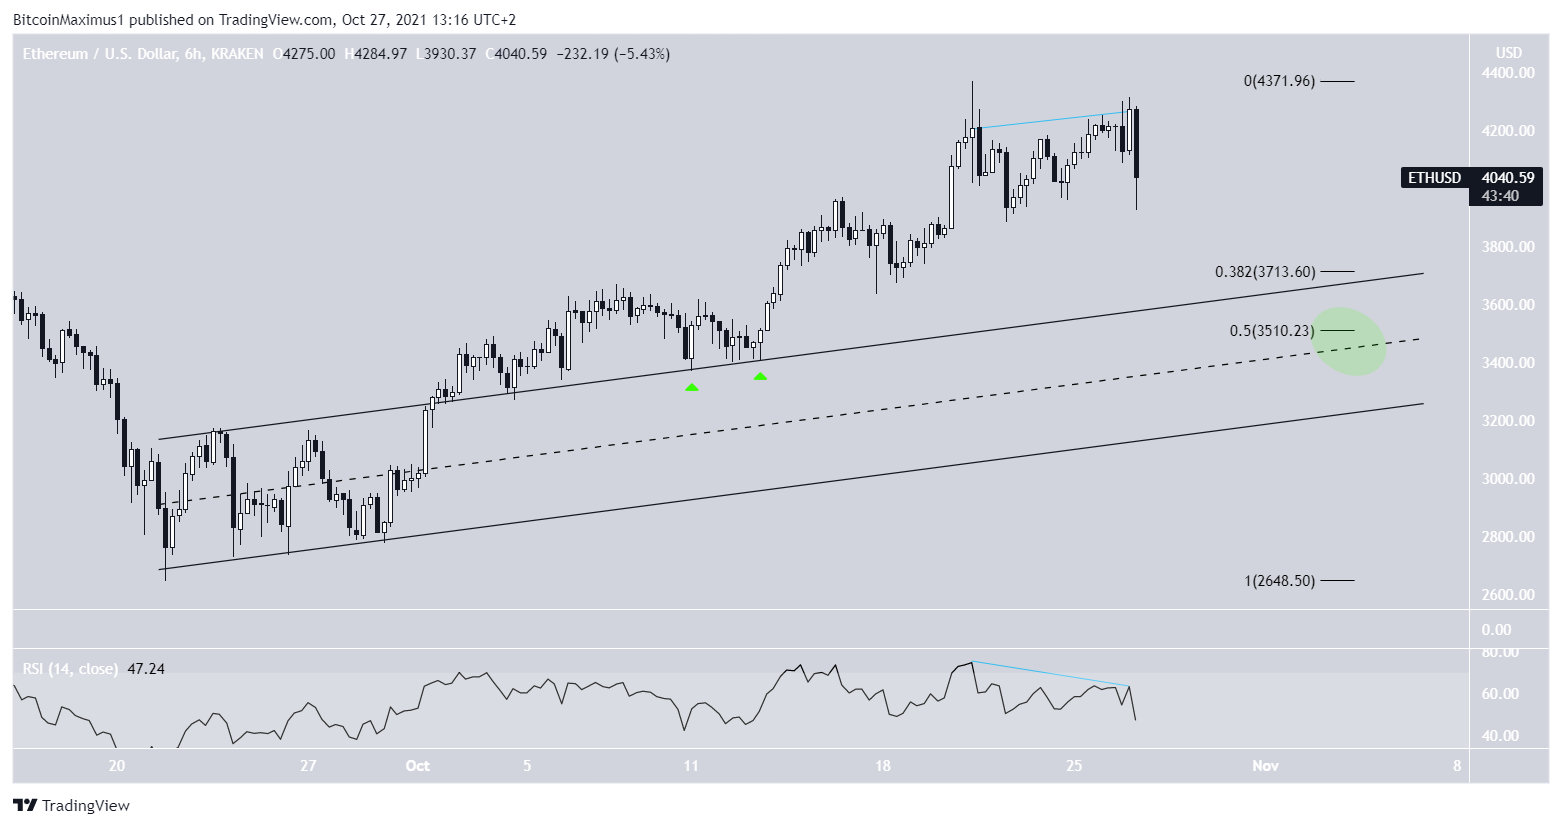
On Oct 21, Ethereum (ETH) reached a high of $4,371. This was only slightly below the current all-time high price of $4,380. However, it decreased almost immediately afterwards.
After regaining its footing, ETH reached a slightly lower high of $4,313 on Oct 27. This created a double top, which is considered a bearish pattern. Furthermore, the tops were combined with bearish divergence in the RSI.
This means that while the price returned to the same level, momentum was considerably lower than the first time. This often precedes sharp reversals.
There is a strong support at $3,710 and $3,510. The former is the 0.382 Fib retracement support level while the latter is the 0.5 Fib retracement support level.
Furthermore, the former coincides with the previous resistance line of a parallel ascending channel, while the latter coincides with the middle of this same channel.
After breaking out, ETH twice validated this channel as support (green icons) on Oct 11 and 13. Therefore, the channel is expected to act as support once more.
XRP
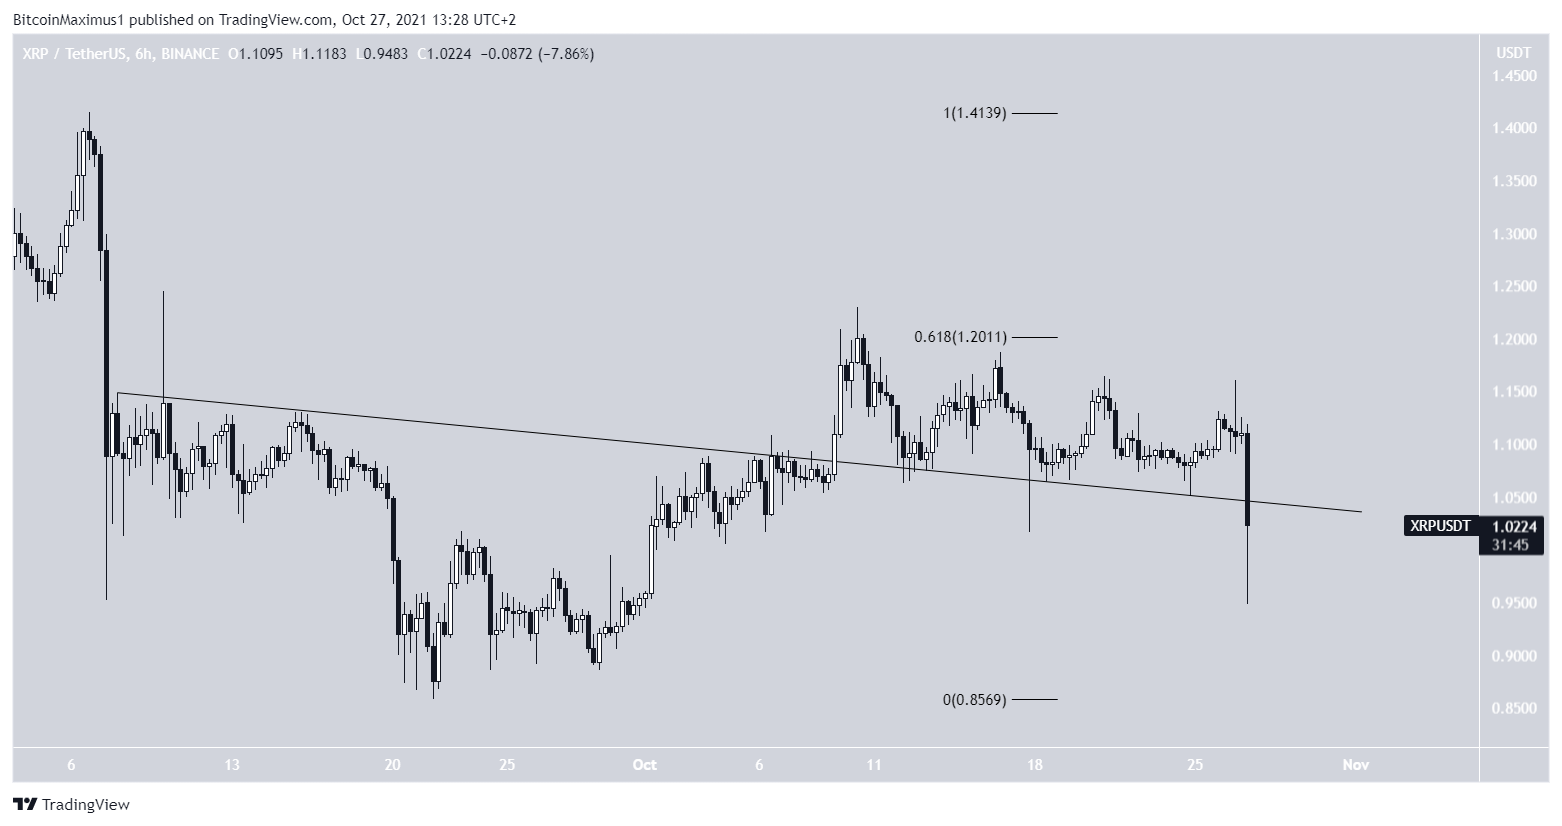
XRP broke out from a descending resistance line on Oct 9. This was a sign that the previous correction had come to an end.
However, it failed to move above the 0.618 Fib retracement resistance level at $1.20.
Since then, it has twice bounced above this resistance line, seemingly validating it as support (green icons).
However, it is currently in the process of breaking down. Whether the token manages to bounce or breaks down below this line will likely determine the direction of the short-term trend.
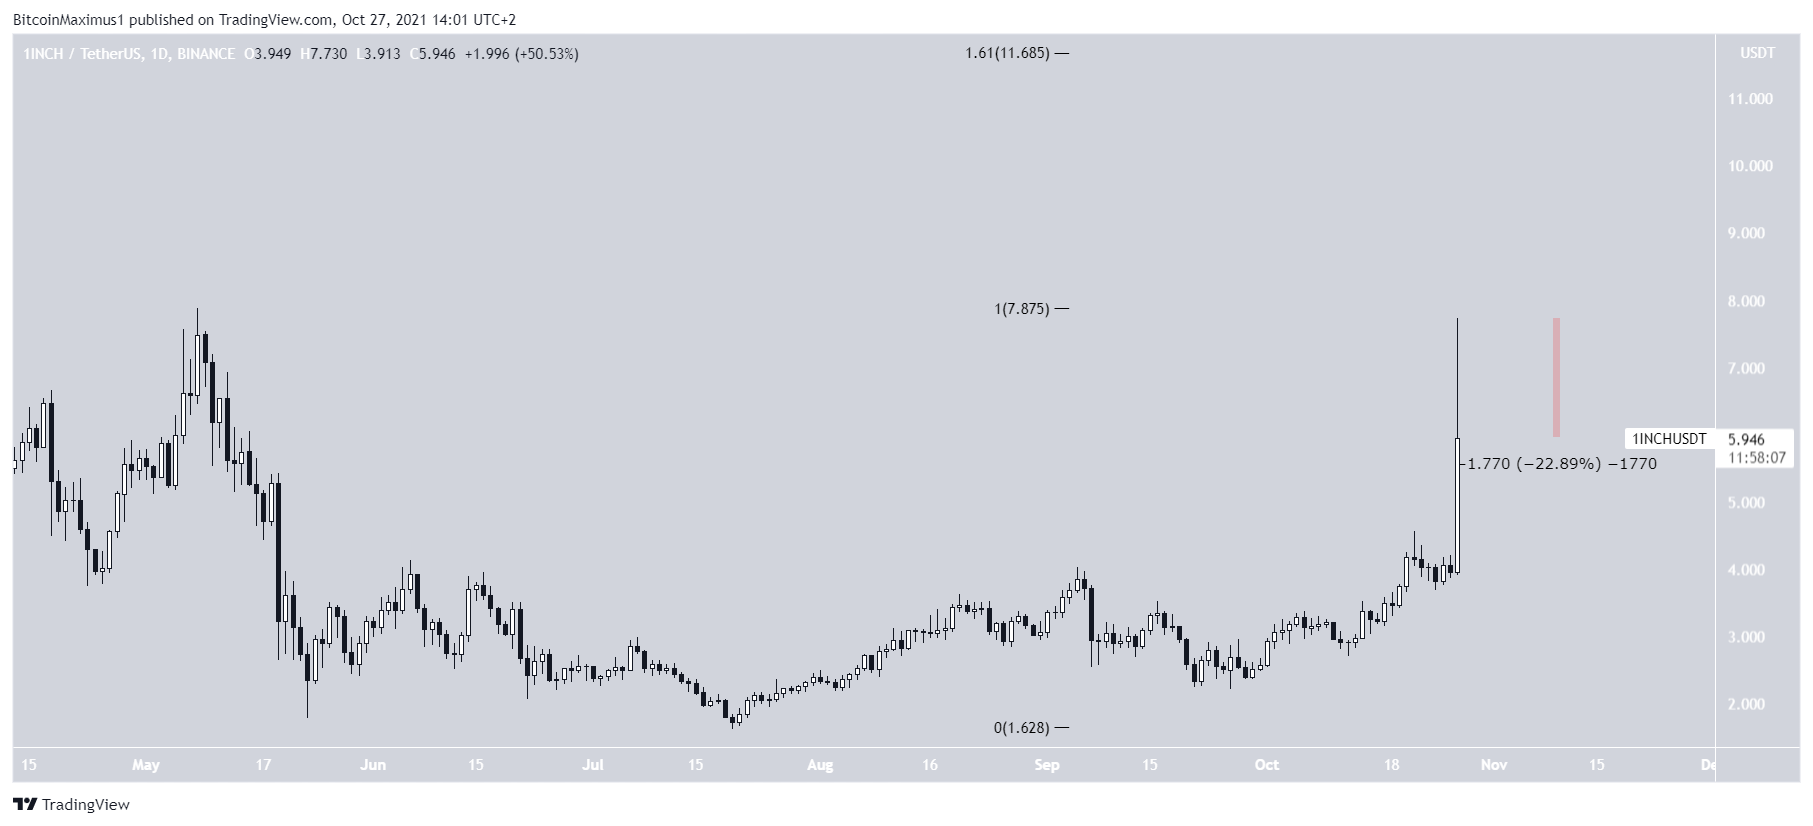
1INCH
1INCH has been moving upwards since Sept 26. The upward movement greatly accelerate on Oct 27, when the token created a large bullish candlestick and nearly reached a new all-time high.
However, it was rejected and has created an upper wick with a magnitude of 23%. This is a sign of selling pressure, since the upward movement could not be sustained.
After 1INCH reached a new all-time high, the next resistance would be at $11.70.
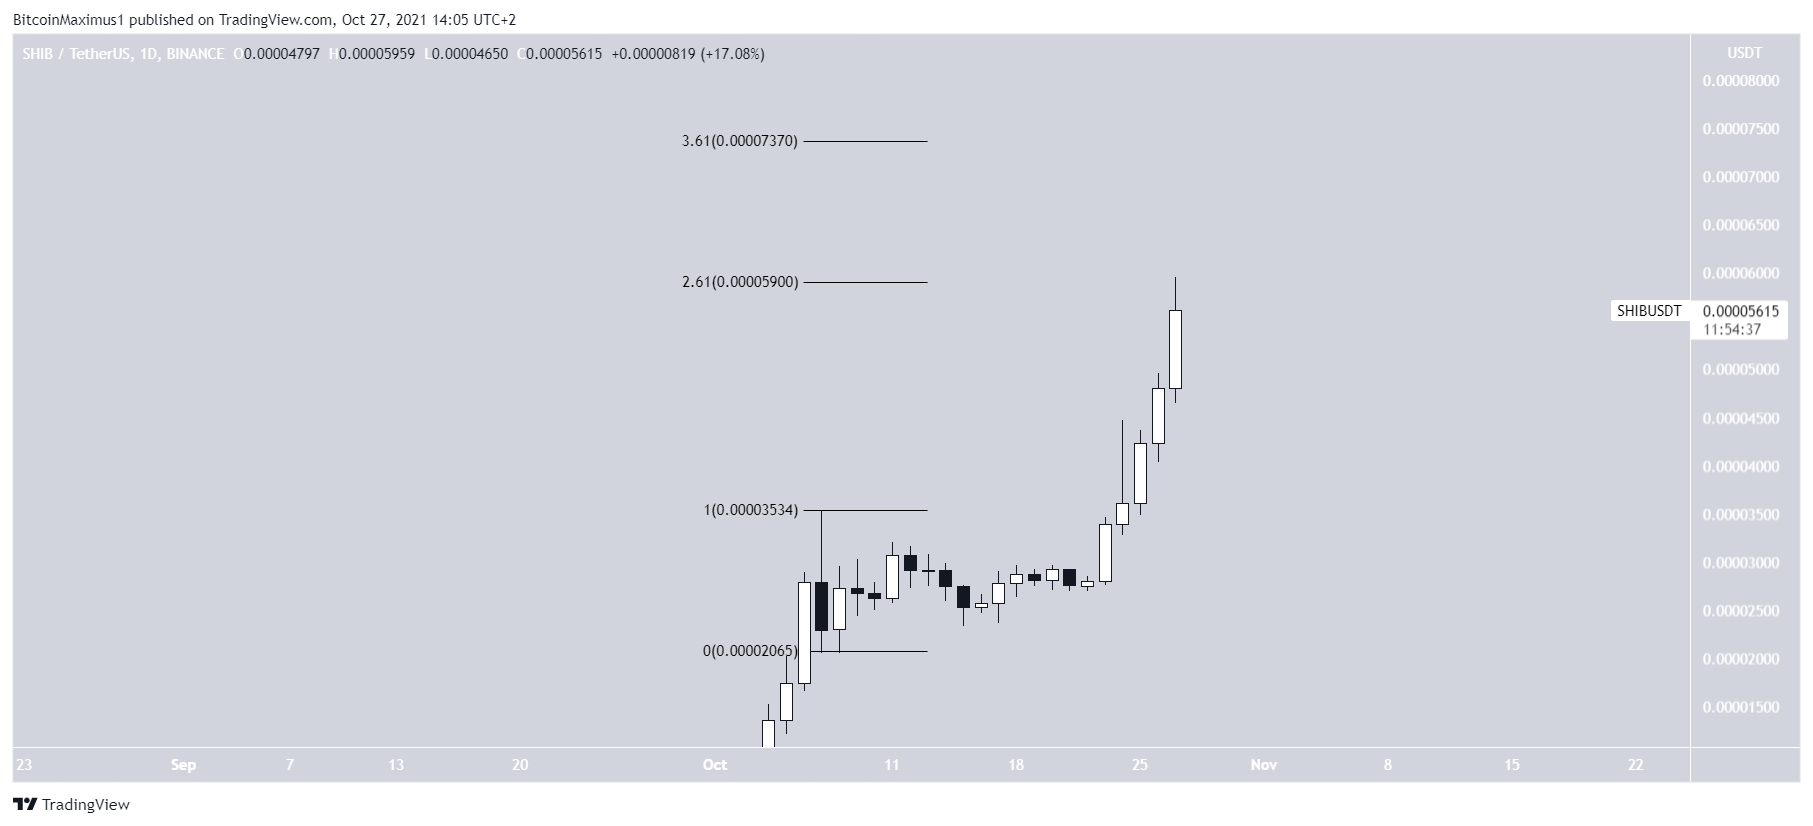
SHIB
SHIB has been increasing at an accelerated rate since Oct 23. On Oct 27, it reached a new all-time high price of $0.000059.
The high was made right at the 2.61 external Fib retracement resistance level when measuring the previous downward movement.
This is a level that often acts as resistance.
If SHIB continues to increase, the next resistance would be at $0.000073. This is the 3.61 external Fib retracement of the same drop.
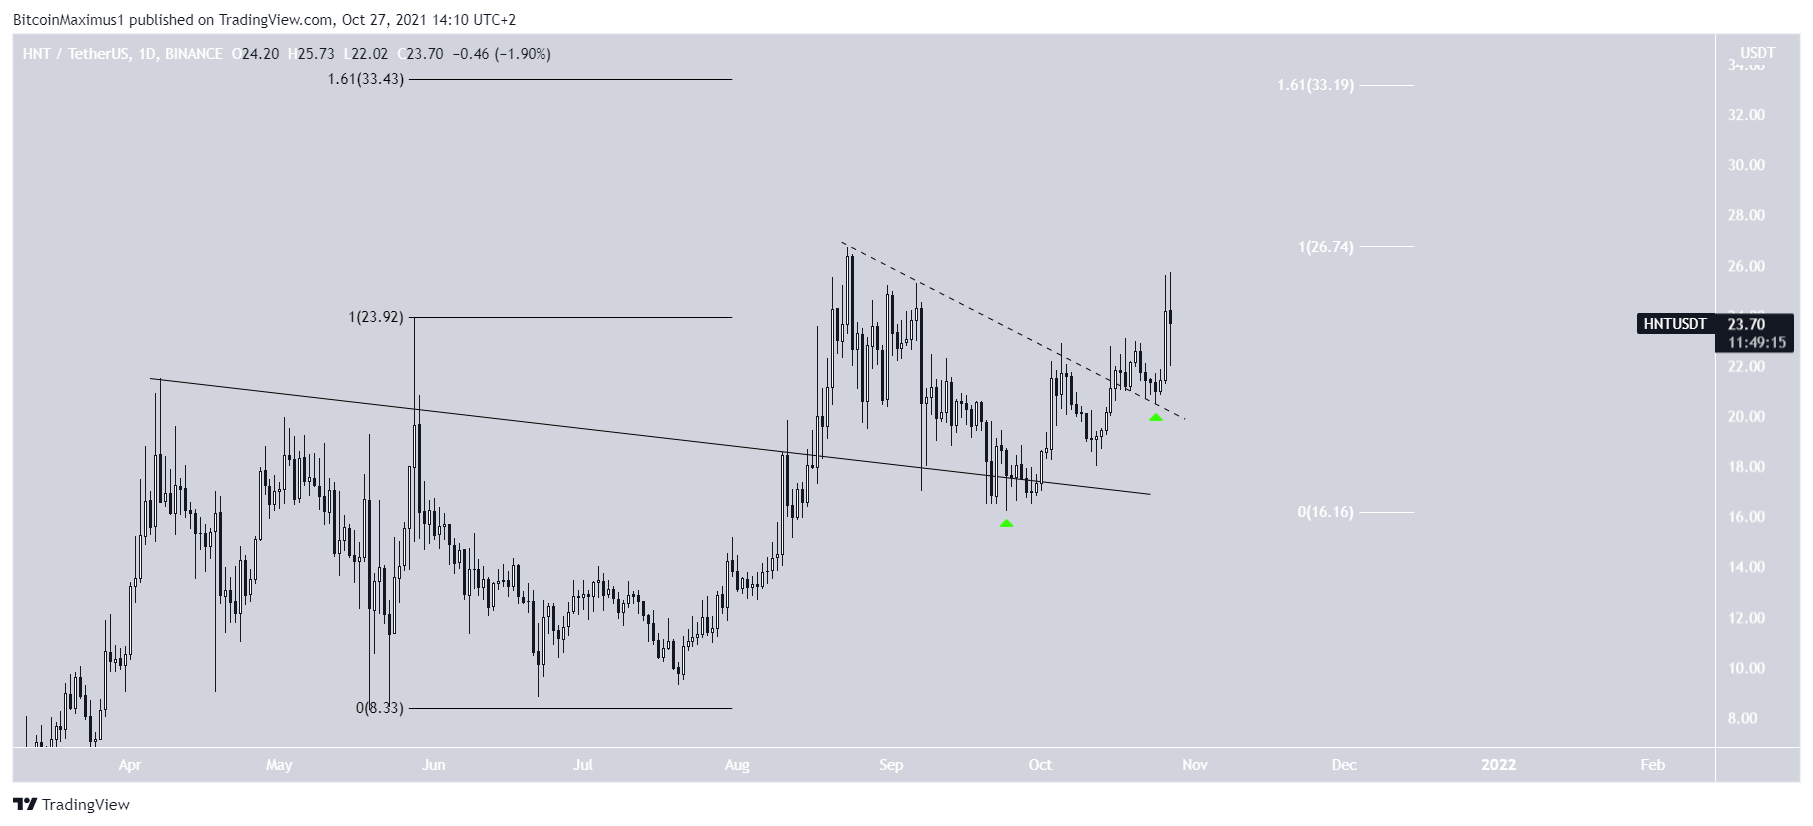
HNT
On Aug 17, HNT broke out from a descending resistance line that had been in place since the previous all-time high price. The indicated that the previous correction had ended.
HNT validated the line as support on Sept 22 (green icon), and proceeded to reach a new all-time high price on Aug 22.
Afterwards, it broke out from a shorter-term descending resistance line (dashed) and validated it as support (green icon). It has been moving upwards since.
Both the long-term (black) and the short-term (white) 1.61 external Fib levels give a target near $33.
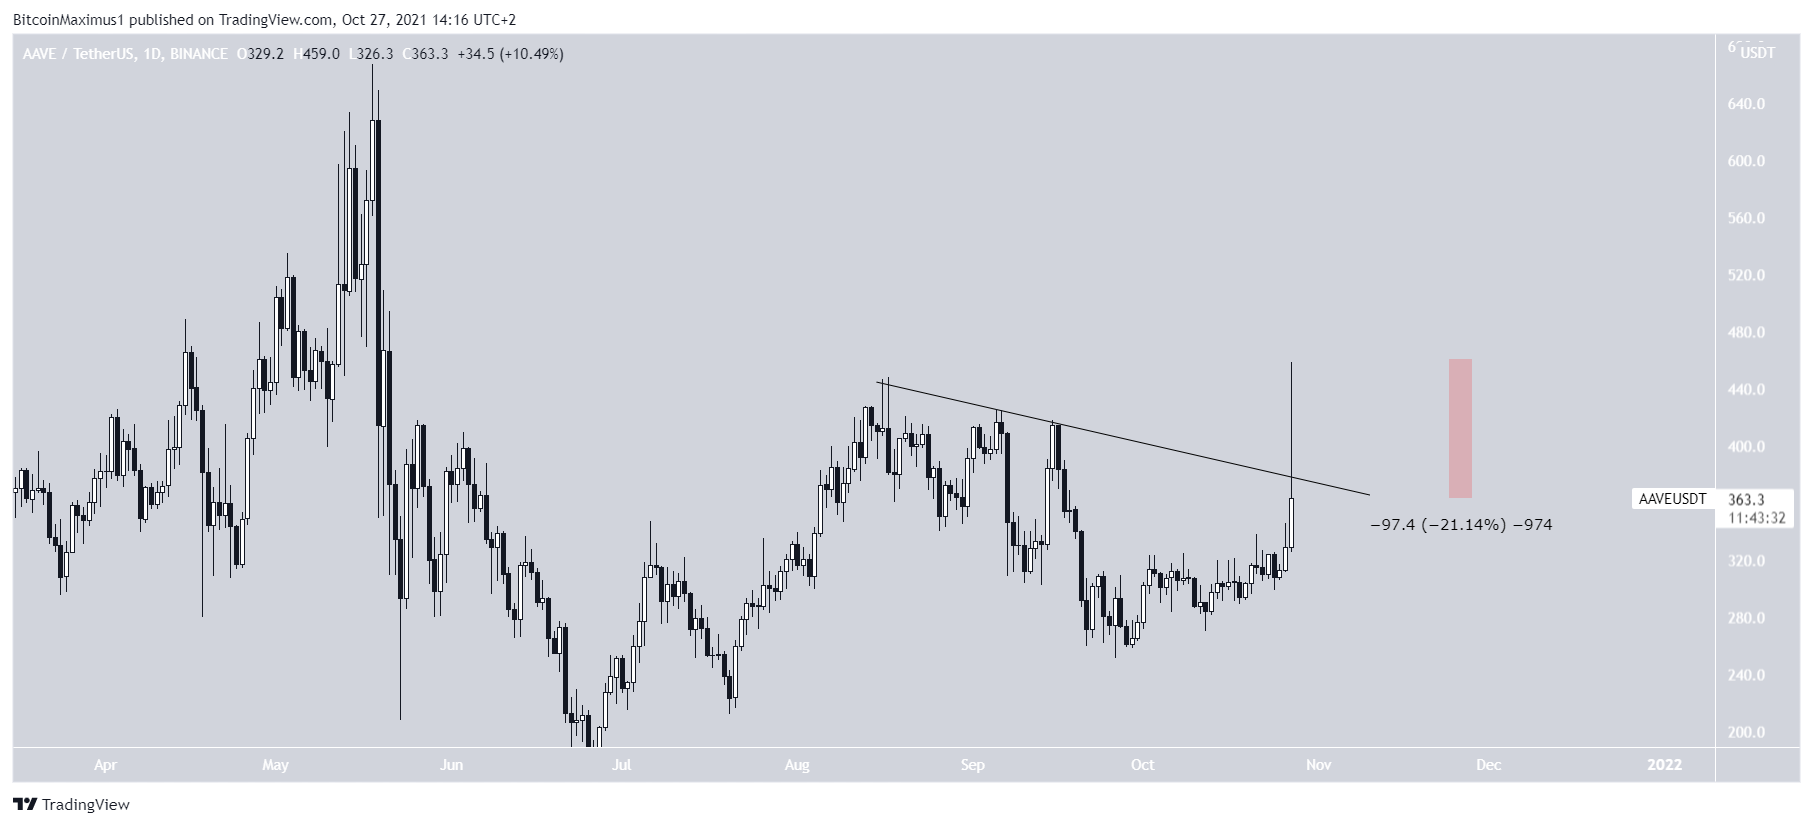
AAVE
AAVE has been decreasing alongside a descending resistance line since Aug 16. Currently, it is making a breakout attempt, which while initially seemed to be successful, it led to a rejection.
Similarly to 1INCH, AAVE has created a long upper wick, which is a sign of selling pressure. The wick has a magnitude of 21%. Until the token manages to break out from this resistance line, the trend cannot be considered bullish.