DASH is focused on offering fast and affordable global payments networks. As it is based on blockchain technology, it is decentralized in nature. DASH, which is a shorter form of Digital Cash, is built on the fork of Litecoin. Let us look at the technical analysis of DASH.
Past Performance
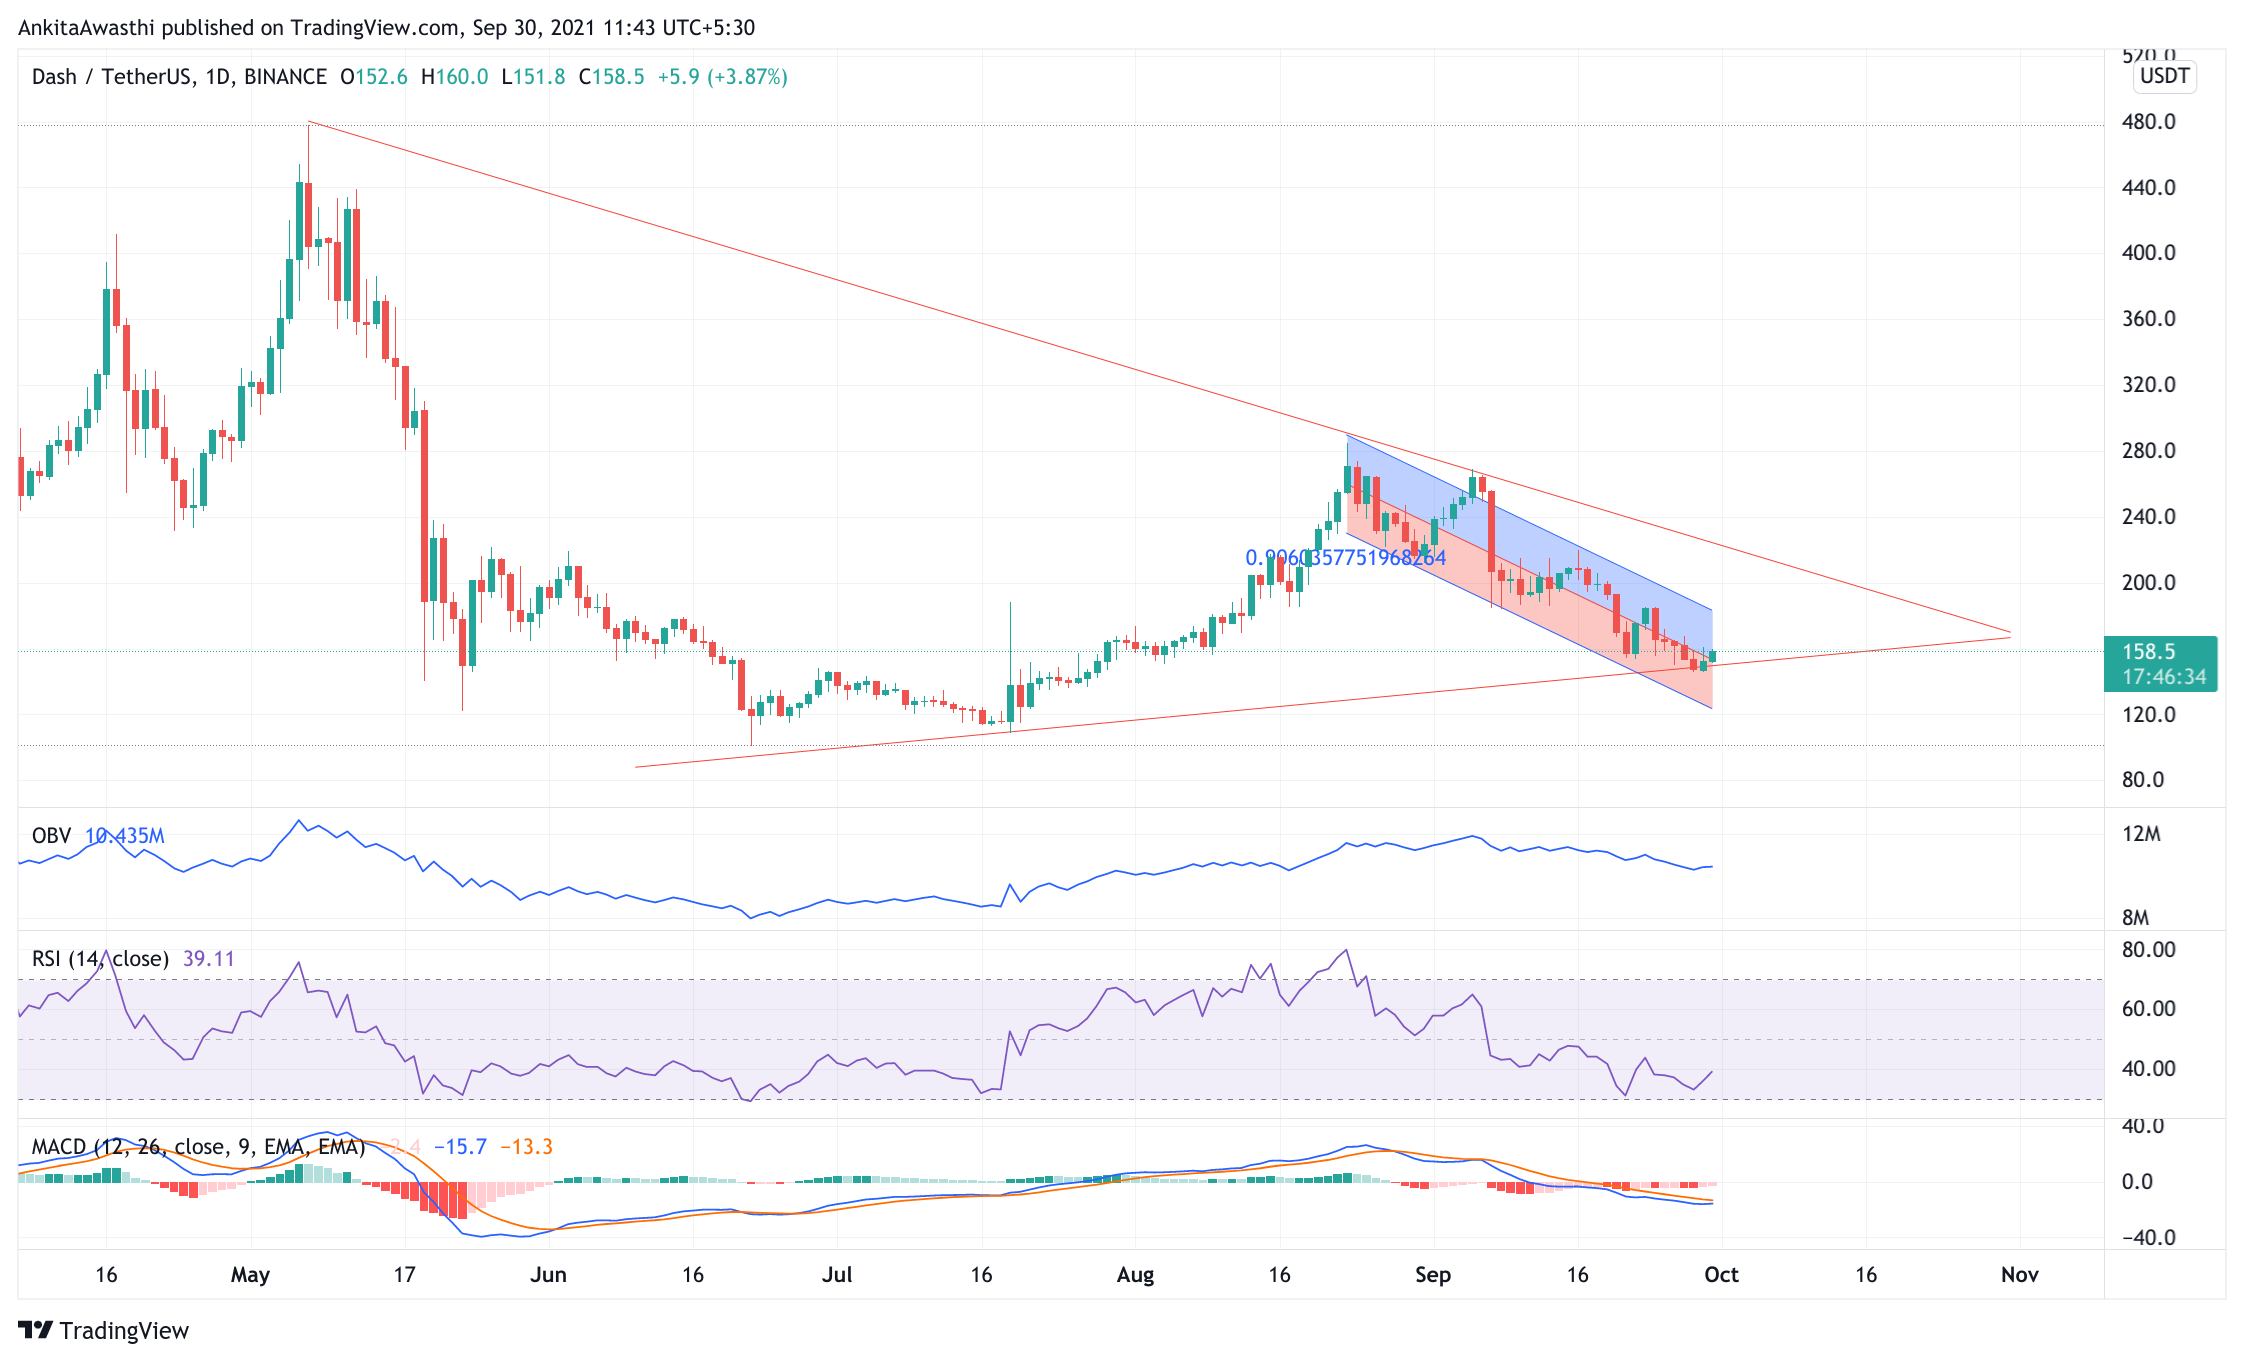
On September 23, 2021, DASH opened at $175.51. On September 29, 2021, DASH closed at $152.15. Thus, in the past week, the DASH price has decreased by approximately 13.13%. Whereas in the last 24 hours, DASH has traded between $150.61-$160.26.
https://www.tradingview.com/x/tBgKs1ye/
DASH Technical Analysis
Currently, DASH is trading at $158.67. The price has increased by approximately 3.11% from the day’s opening price. Thus, the market seems bullish.
The MACD and signal lines are in the negative zone. However, a bullish crossover by the signal line over the MACD line can be witnessed. But, the overall market momentum is bearish. Hence, the price may decline further.
Currently, the RSI indicator is at 39.19. It faced rejection at 34 and rose to this level. Thus, buying pressures are slowly mounting. We have to wait and watch if buying pressures become strong enough to bring about a trend reversal for DASH.
The OBV indicator is upward sloping. Thus, buying volumes are higher than selling volumes.
In short, when we look at all three oscillators, we can say that the price may continue to rise. However, we cannot rule out the possibility of a trend reversal. We have to wait and watch to see if an intermittent price rise is a corrective action or the beginning of a positive trend.
Day-Ahead and Tomorrow
Currently, the DASH price is below the second Fibonacci pivot point of $185. If the bears take control, then the price is likely to fall below the first, second, and third support levels of $147, $115, and $98.9, respectively.
The price has tested and fallen below the 38.2% FIB retracement level of $185.2. It may soon rise above the FIB retracement level of $185. A breakout from this level highlights the next resistance at $218. Traders can take a long position accordingly.
Thereafter, we have to wait and watch if the price retests and breaks out of these levels. In that case, the price upswing is likely to continue tomorrow as well.