KLAY token price is under high selling pressure. Breakout of the next support zone could prove fatal.
As an ecosystem of a wide array of decentralized applications (DApps), Klaytn is an ecosystem that offers a variety of decentralized apps (DApps). This gives users the chance to create or find the right type and size of the application. App publication isn't restricted and users can use the platform in virtually any way they wish. Klaytn supports DApps across a variety of areas, including digital asset management and art collecting and trade.
Past Performance of KLAY
Since the breakout of the double top pattern on 26th August, the KLAY token price fails to rise above the long-coming resistance trendline. Numerous bullish attempts share the same fate of rejection from the resistance trendline. Furthermore, the downfall of more than 35% in the past month brings the price closer to the support zone near $1.10.
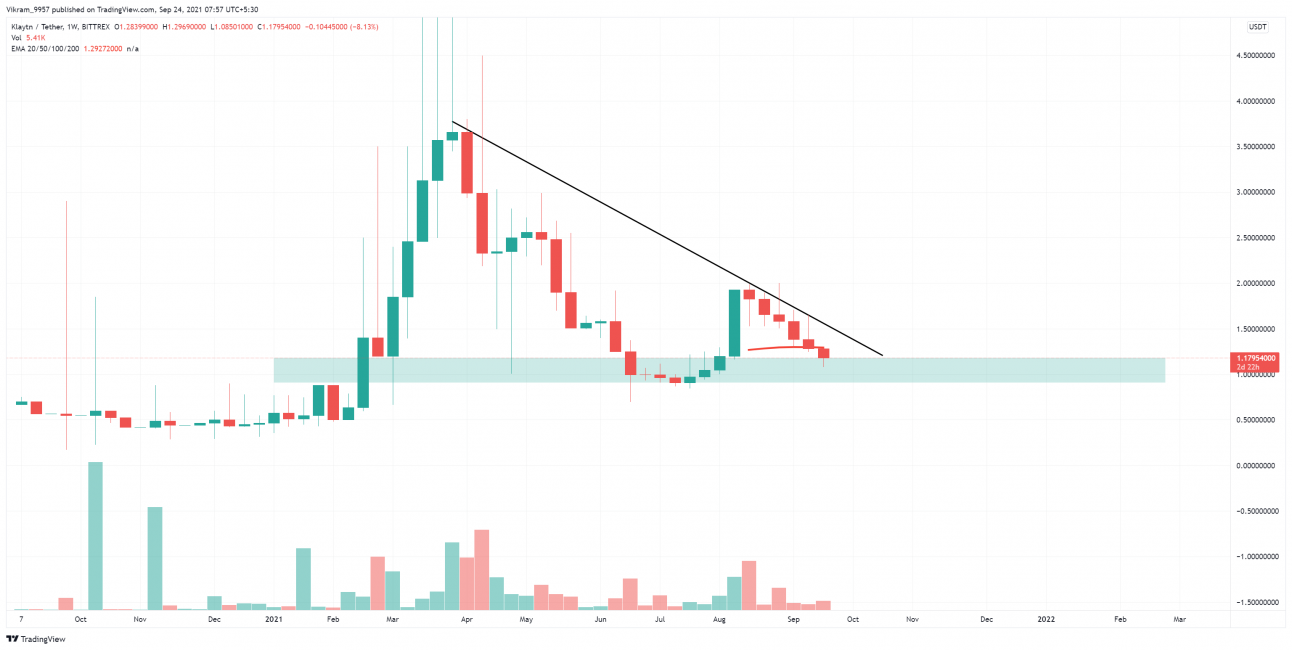
Source - Tradingview
KLAY Technical Analysis
At the time of this writing, the KLAY crypto price is $1.14. It has experienced a fall of 0.70% in the last 24 hours. This suggests a potential bearish follow-through, with a gradual rise of bearish pressure. However, the support zone near the $1.10 mark might be able to reverse the bearish trend.
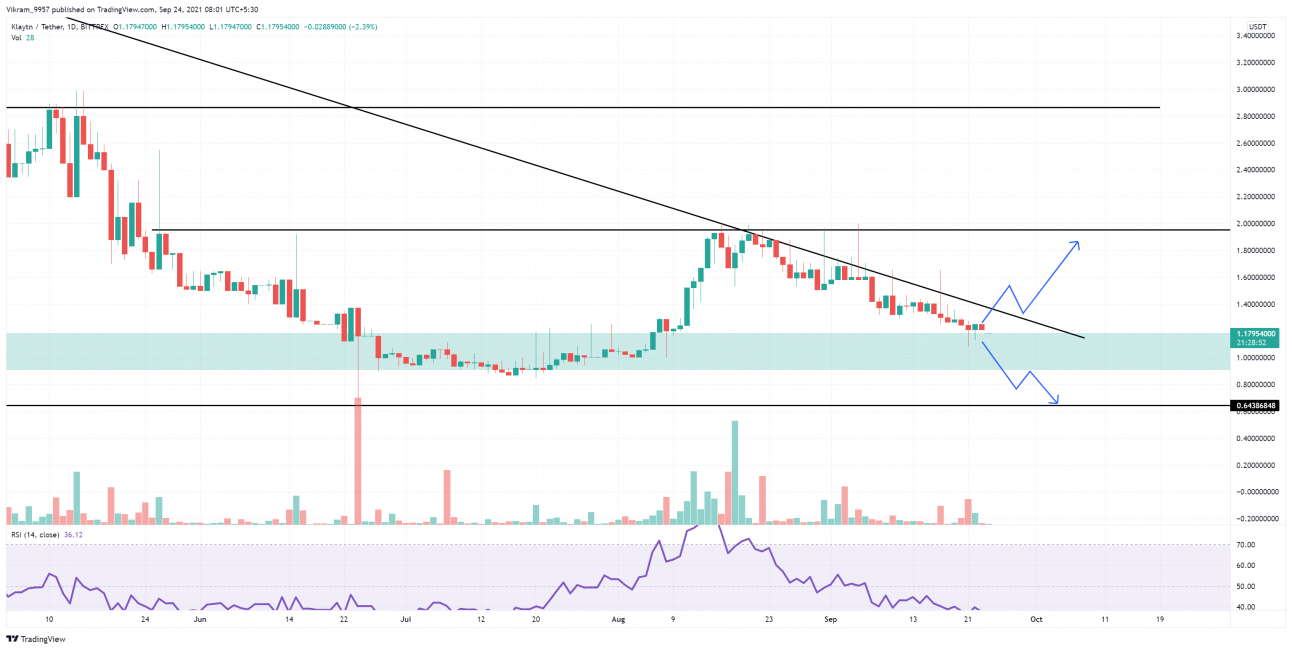
Source - TradingView
The long-coming resistance trendline and the crucial support zone make a descending triangle. The pattern can give a breakout on either side, but the increasing selling pressure increases bearish possibilities. We can wait till the pattern comes to fruition to decide our trade more accurately.
The KLAY token value is under the daily exponentially rising averages of 100 and 200-day. A bearish crossover possibility could be high, as the 50-day EMA curve could signal a multifold increase in underlying bearishness.
An indicator that you have an opportunity to buy is the MACD line and signal line on the daily chart. A strong selling power can also be indicated by the increase in bearish Histogram if both lines trade below the zero mark.
The slope of the RSI indicator currently is below the daily charts' central line. After it was removed from the central lines, RSI support fell to 30%. To reach oversold territory, the slope continues to fall.
Day-Ahead and Tomorrow
KLAY token price bottles up within the descending triangle made by the trendline and the zone. A breakout on either side can help us decide the future trend.
Investors can wait for the retest of the breakout in a shorter time frame to avoid risking their profits in a fake breakout.