CAKE token price resonates within a triangle pattern. The possible breakout of this triangle can bring a boom with a bullish rally.
PancakeSwap employs an automated market maker model. This means that there are no order books and instead liquidity pools are used. An individual can earn income by becoming a liquidity provider. By adding tokens to the liquidity pool, they can farm LP tokens or stake their CAKE to receive rewards. They can also gamble with non-fungible tokens and lotteries.
The PancakeSwap token, CAKE, is a BEP-20 token originally launched on Binance Smart Chain. CAKE's main purpose is to encourage liquidity provision to PancakeSwap.
Past Performance of CAKE
On September 20th, CAKE coin price, after forming a double top pattern near the resistance trendline, found a huge supply dump. Thus, resulting in a downfall of 16% and making a bearish engulfing candlestick. The fall drove the price near the support zone at $19. Since then, the price retraces its steps upwards back to the resistance trendline.
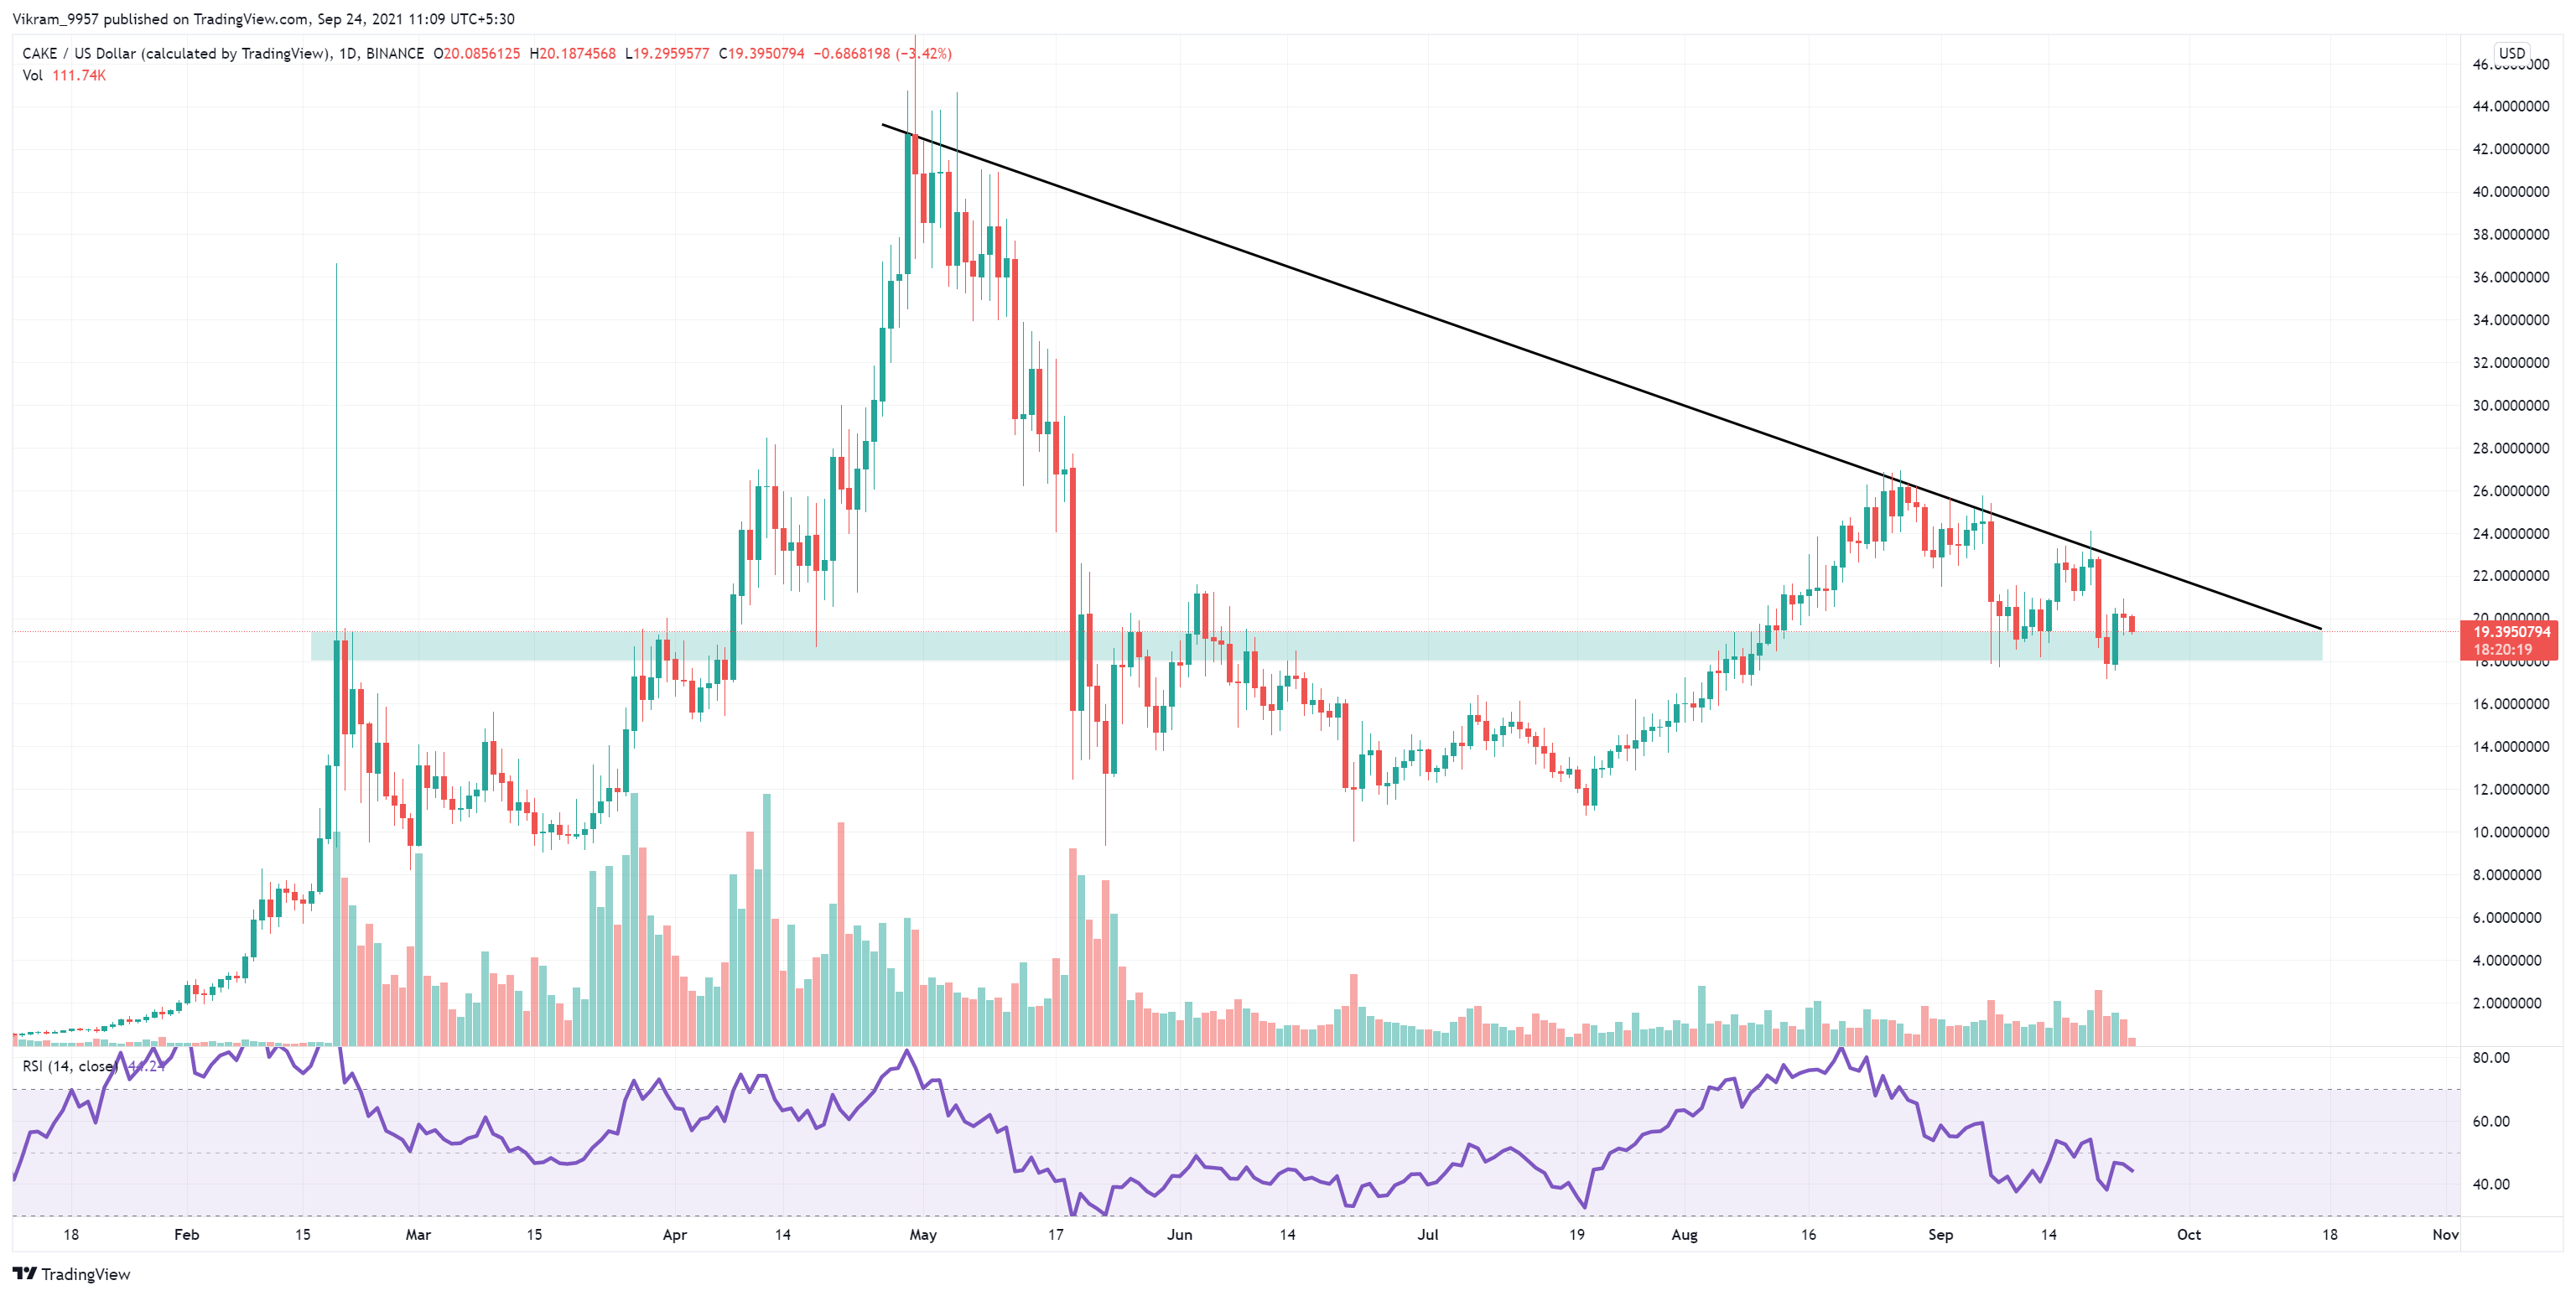
Source - Tradingview
CAKE Technical Analysis
CAKE crypto is currently at $19.50 as of writing this article. However, it has seen a drop of 4.06% within 24 hours. This suggests that the market could be heading in a bearish direction, with increasing selling pressure. But, the support zone around $19 could be able to reverse this bearish trend.
A descending triangle pattern is made by the long-term resistance line and the critical support zone. While the pattern suggests a breakout on either side, increased selling pressure could increase bearish potential. You can wait for the pattern to come to fruition before making your trade.
The daily exponentially rising 50-day averages for the CAKE token are lower than the CAKE token's value. There is a high probability of a bearish crossover between the 50-day EMA and the 100-day EMA. The 50-day EMA curve may signal a multifold rise in underlying bearishness.
MACD and signal lines on the daily chart are both indicators of whether you have an opportunity to sell. An indicator of strong selling power is the bearish histogram rise if both lines trade lower than the zero mark.
The slope of the RSI indicator is currently below the daily charts' central lines. RSI support decreased to 44% after facing rejection from the central lines. The slope continues to slide in an attempt to get into oversold territory.
Day-Ahead & Tomorrow
CAKE token prices may rise within the descending triangle created by the zone and the trendline. Thus, we can determine the future trend by making a breakout from either side.
Investors can delay the retest of a breakout to save their profits and avoid a fake breakout.