Bitcoin Analysis
Bitcoin’s price lost support resistance at $43k on Tuesday before heading into its final 4hr candle of the day.
The 4hr bitcoin chart below from VincePrince shows what appears to be a bear-flag forming with the potential for bearish continuation down to the $39,650-$40,600 level.
BTC’s RSI is at its lowest level on the 4hr timescale in more than one year, at the time of writing.
If bears are able to break the $40k level there’s not a lot of resistance on the 4hr chart between the $39k-$40k level and the price trading down to re-test $32k.
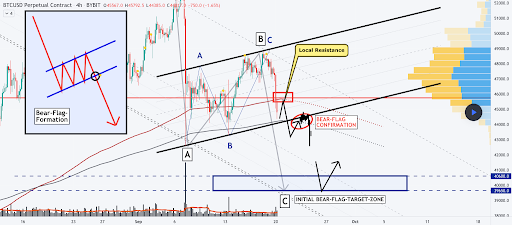
If bitcoin bulls want to stop BTC’s price from further bleeding they need to reclaim the price territory above $43,5k and optimally above $46,5k before the weekly timescale closes.
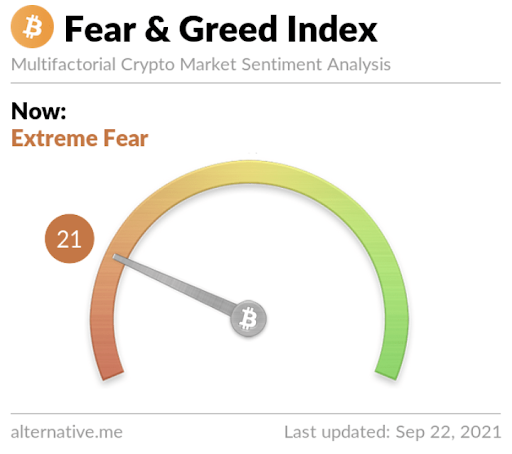
The Fear and Greed Index is reading 21 and in the Extreme fear region of the metric, the current reading is -6 from yesterday’s measurement of 27 and Fear.
BTC’s 24 hour price range is $40,203-$43,645 and the 7 day price range is $40,203-$48,852. Bitcoin’s 52 week price range is $10,255-$64,804.
Bitcoin’s 30 day average price is $47,397.
BTC [-5.44%] closed Tuesday’s daily candle in red figures for a 3rd consecutive day worth $40,664.
Ethereum Analysis
Ether lost $3k as support resistance on Tuesday and is now testing the next support levels mentioned in yesterday’s analysis at $2,955 on the 4hr chart and $2,620 on the daily timescale.
The chart below from AtlasTrades shows Ether consolidating at $2,965 on the 2hr chart which corresponds to the nearest aforementioned support resistance on the 4hr chart.
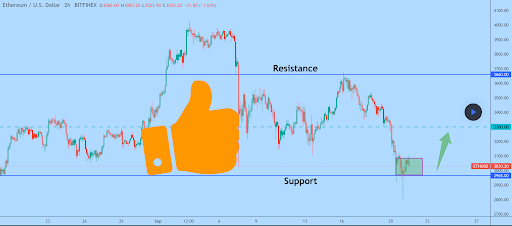
The chartist above posits the consolidation at this level is a good opportunity to go long. If Ether can flip $3k back to support resistance the next targets on the 2hr are $3,300 and then $3,660.
ETH’s 24 hour price range is $2,718-$3,098 and the 7 day price range is $2,718-$3,665. Ether’s 52 week price range is $320-$4,352.
ETH’s 30 day average price is $3,393.
Ether [-7.08%] closed Tuesday’s daily candle worth $2,765 and in red figures for a 3rd straight day.
Solana Analysis
There’s an ongoing battle at the $130 level between Solana bulls and bears that’s heating up. For the first time since September 2nd bears were able to send SOL lower than the $130 level and the price even wicked down below $120 briefly.
With so much positive price action over the last 60 days Solana’s now trying to find a true level to consolidate at while the negative momentum wains and positive momentum can again build. Solana is -40.2% from it’s all-time high of $215.19 that was made on September 9th.
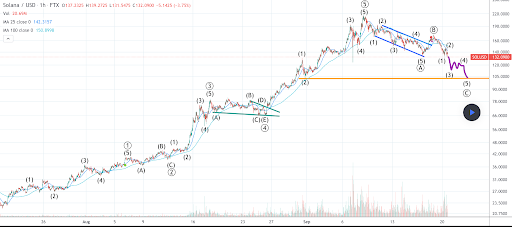
The 1hr Solana chart above from quantmaven paints a short-term bearish outlook for SOL. The above analysis shows the potential for bears to push the price below strong support resistance at $130 and send the price all the way down to the $105 level.
Solana’s 24 hour price range is $119.47-$144.17 and the 7 day price range is $119.47-$170.14. SOL’s 52 week price range is $1.03-$215.19.
Solana’s 30 day average price is $133.31.
SOL [-13.23%] closed Tuesday’s daily candle worth $123.81 and in red digits for a third consecutive day.
Solana [-22.06%] also closed the weekly timeframe in red digits for the second straight week after rattling off eight consecutive green weekly candle closes prior.