Nano (NANO) has broken down from an ascending support line that had previously been in place since July 20.
It is attempting to hold on above the $4.92 support area and the 2-4 trendline. Doing so is mandatory if the upward trend is to continue.
NANO breaks down
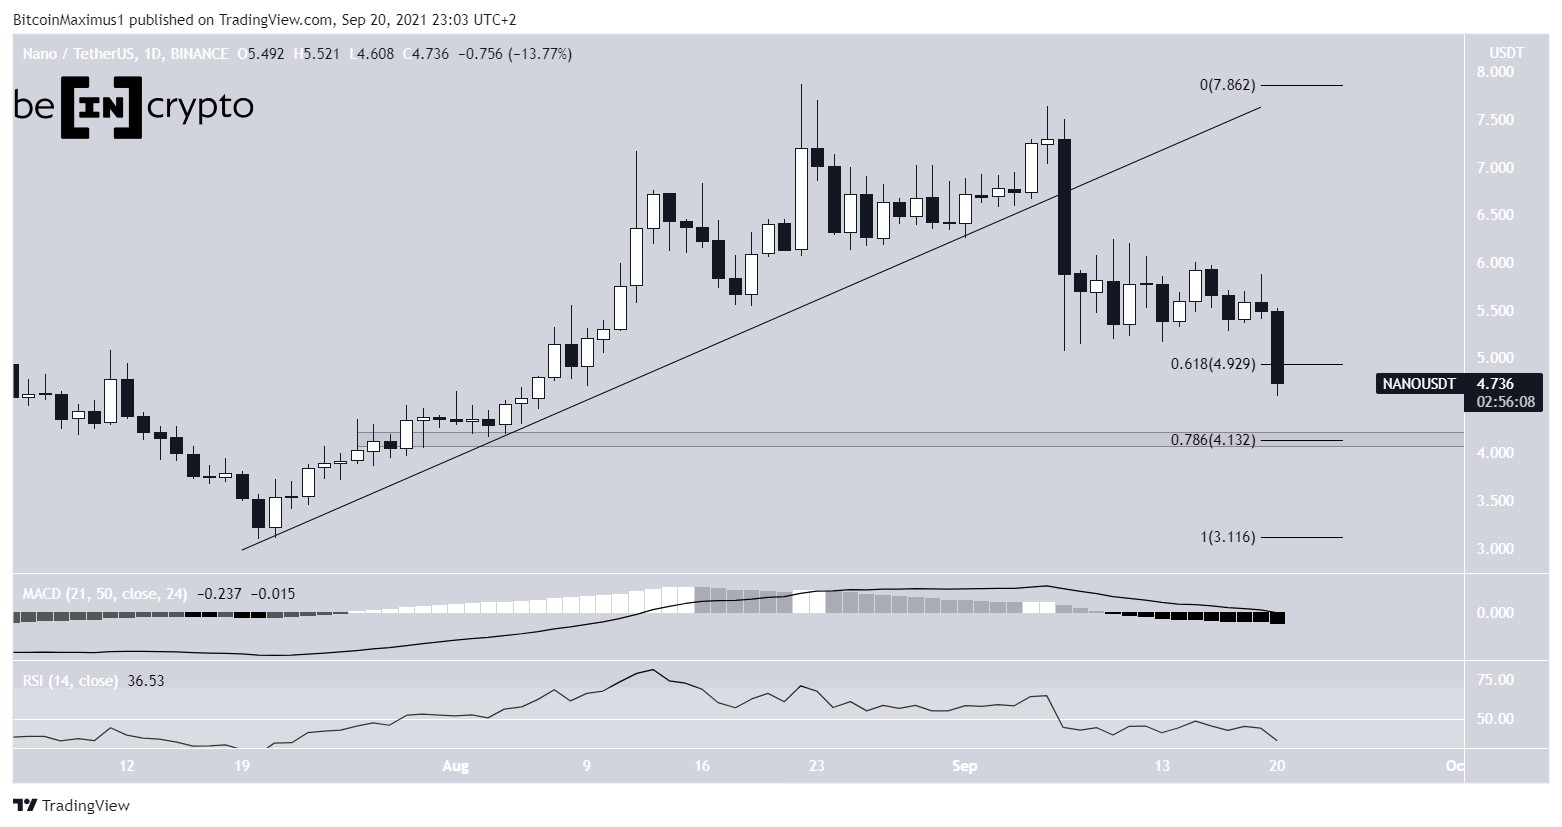
NANO had been moving upwards since July 20, following an ascending support line. This led to a high of $7.87 on Aug 22.
However, NANO has been falling since. It created a lower high on Sept 6 and broke down from the ascending support line the next day.
Currently, it’s trading close to the 0.618 Fib retracement support level at $4.90.
If it were to break down, the next support would be found at $4.15. This target is the 0.786 Fib retracement support level and a horizontal support area.
Technical indicators are bearish, supporting the continuation of the downward movement. The MACD is nearly negative and the RSI is below 50.
Short-term movement
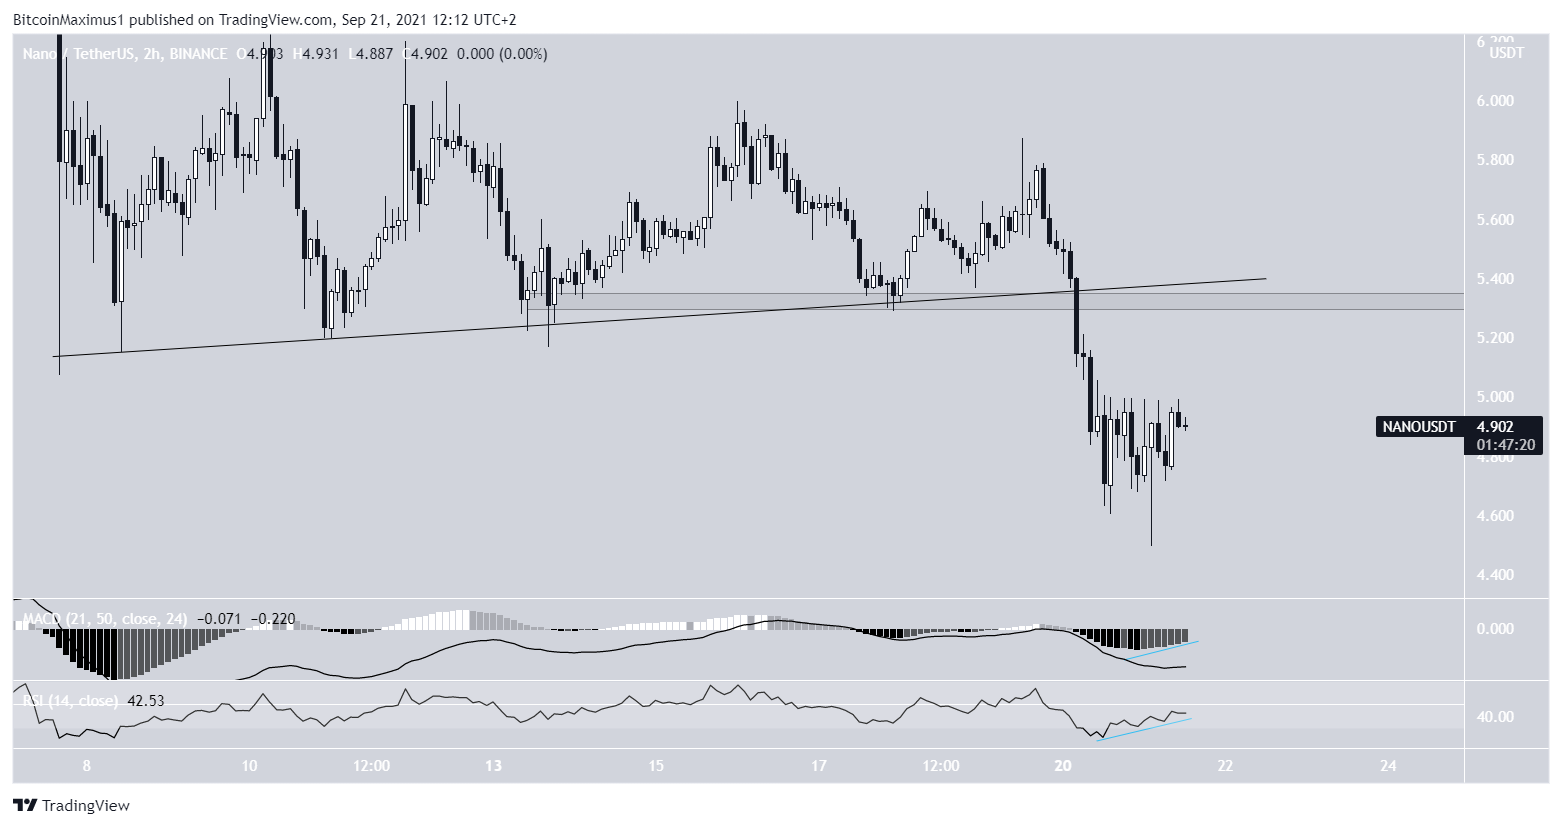
The two-hour chart is more bullish and indicates that a bounce is likely.
Both the RSI and MACD have generated bullish divergences, a sign that usually precedes upward moves.
However, there is a strong resistance near $5.30 in the form of a horizontal resistance level and a short-term ascending support line.
Therefore, until that area is reclaimed, the short-term trend cannot be considered bullish.
Wave count
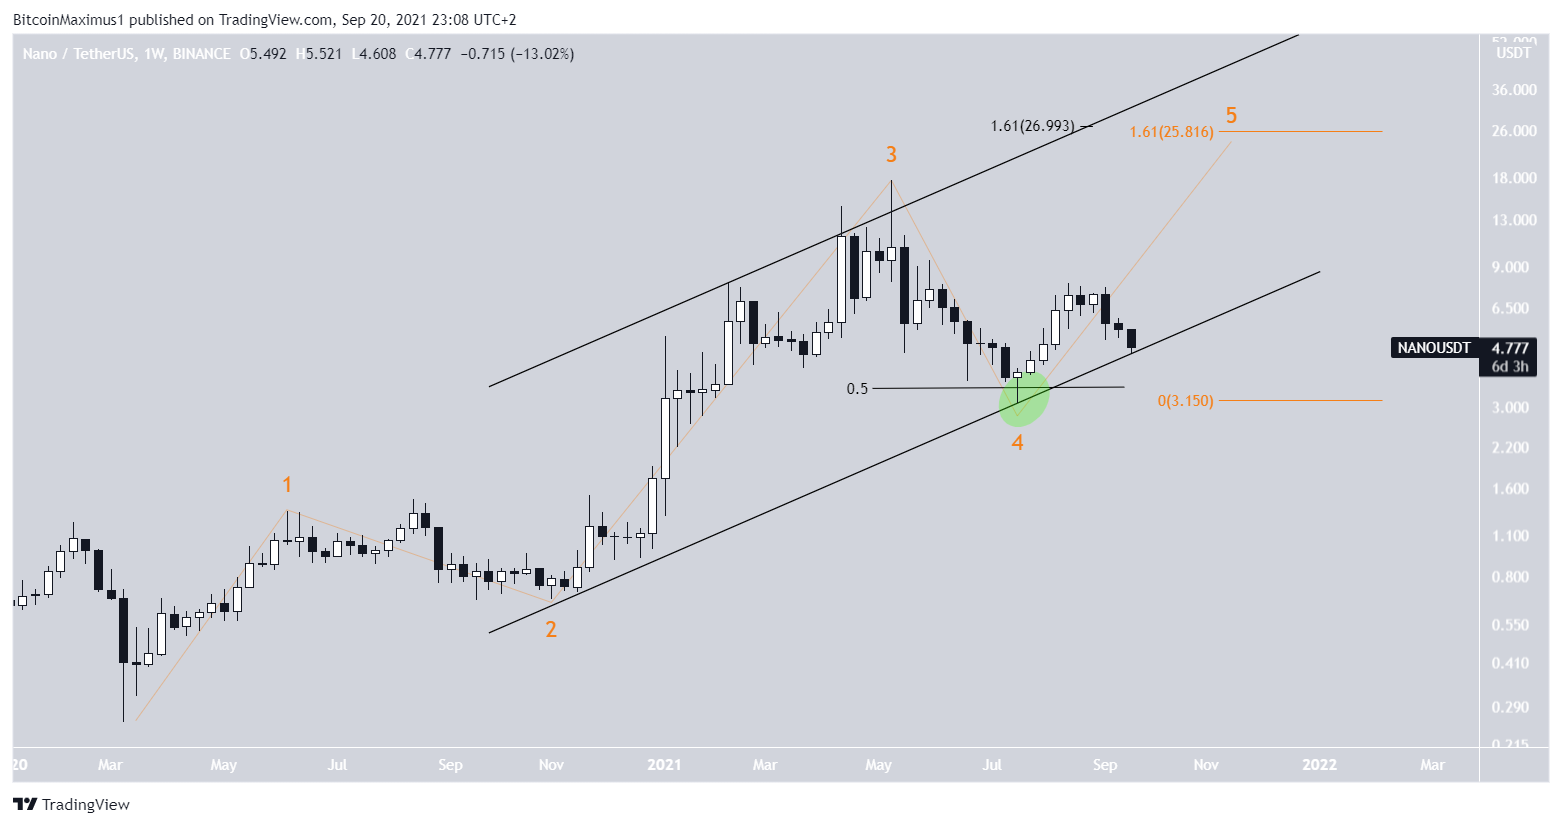
Cryptocurrency trader @Mesawine1 outlined a NANO chart, stating that it could be in the fifth and final wave of a bullish impulse.
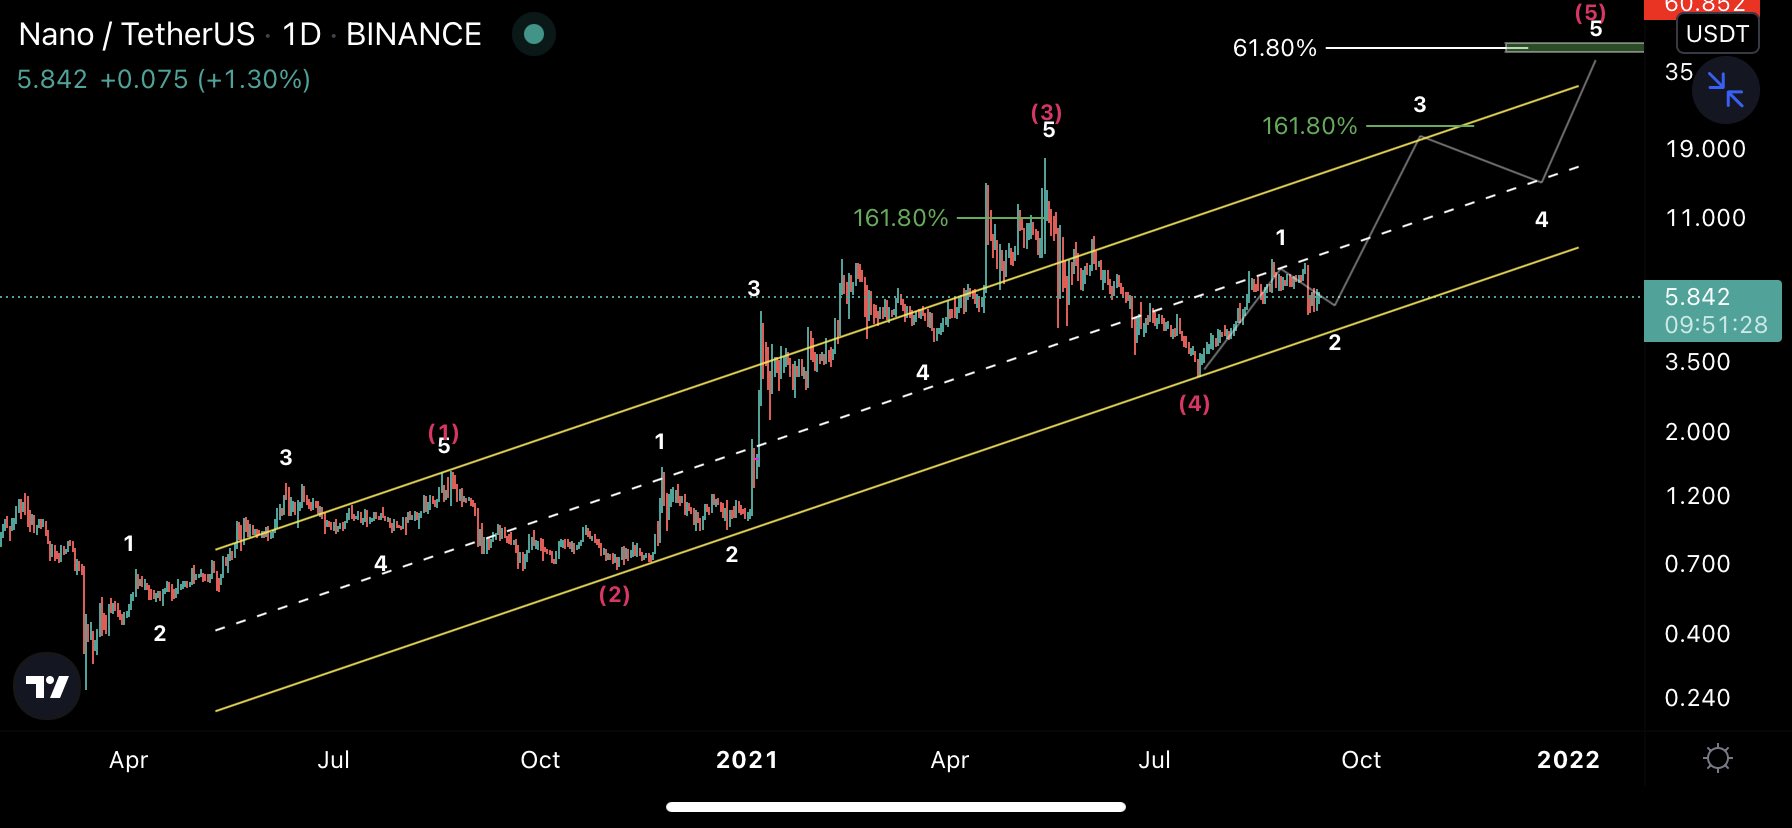
The most likely wave count suggests that NANO is in wave five of a bullish impulse that began in March 2020.
It’s possible that the corrective wave four ended with the $3.10 low on July 20 (green circle). In this case, a potential target for the top of the upward move would fall between $25.80-$26.99. The target is found by the 1.61 length of waves 1-3 (orange) and the 1.61 external Fib retracement of wave four (black).
However, it’s barely holding on above the channel connecting the 2-4 wave lows. A breakdown below it would invalidate this potential count.