The total cryptocurrency market cap (TOTALCAP) has reclaimed the $2 Trillion (tn) support level.
The altcoin market cap (ALTCAP) has created a double top pattern.
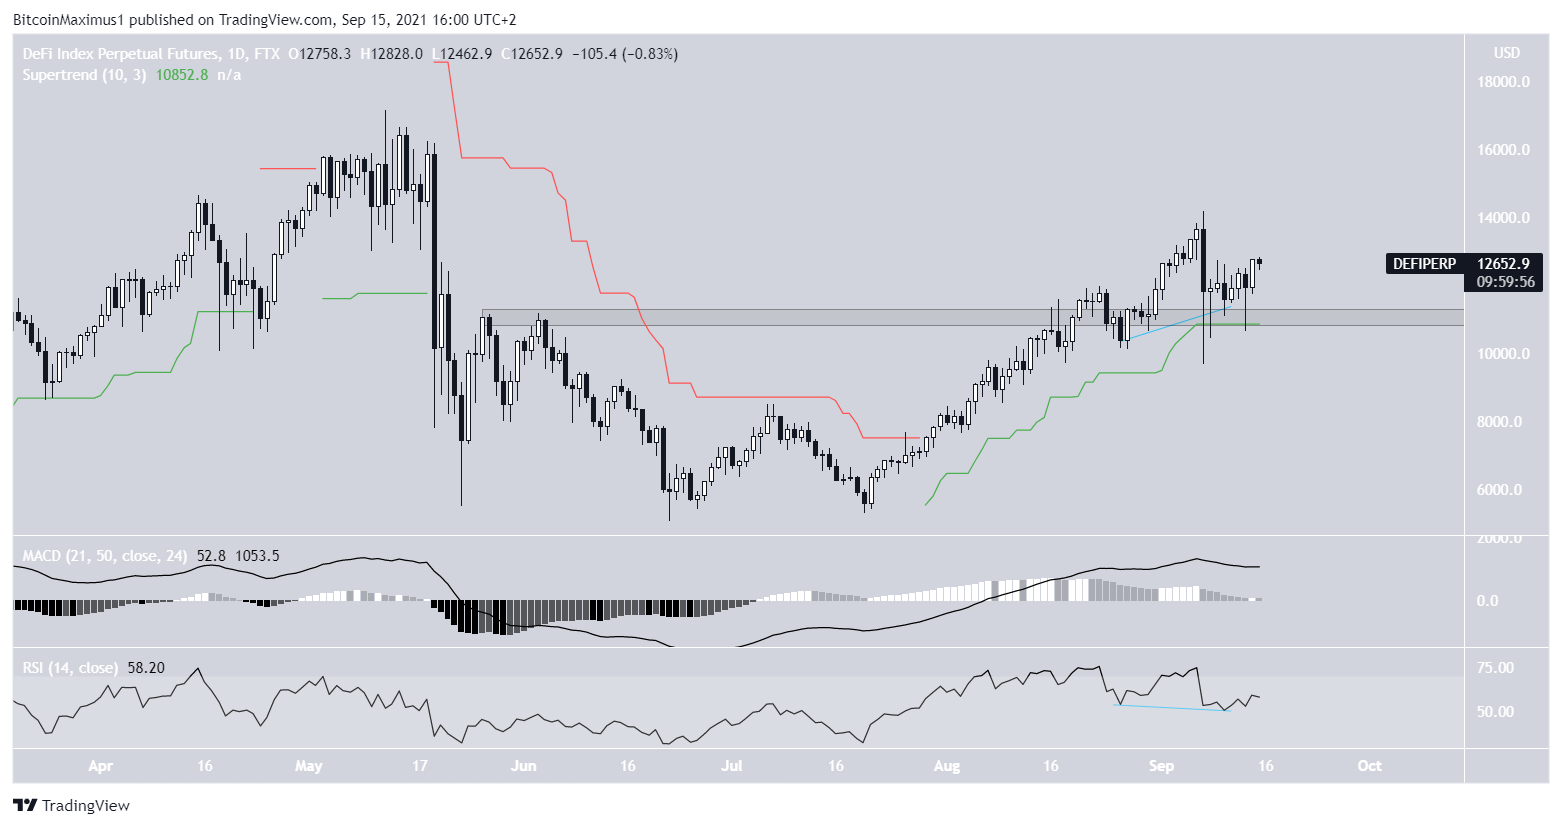
The DeFi index (DEFIPERP) has bounced at the $11,000 support area.
TOTALCAP
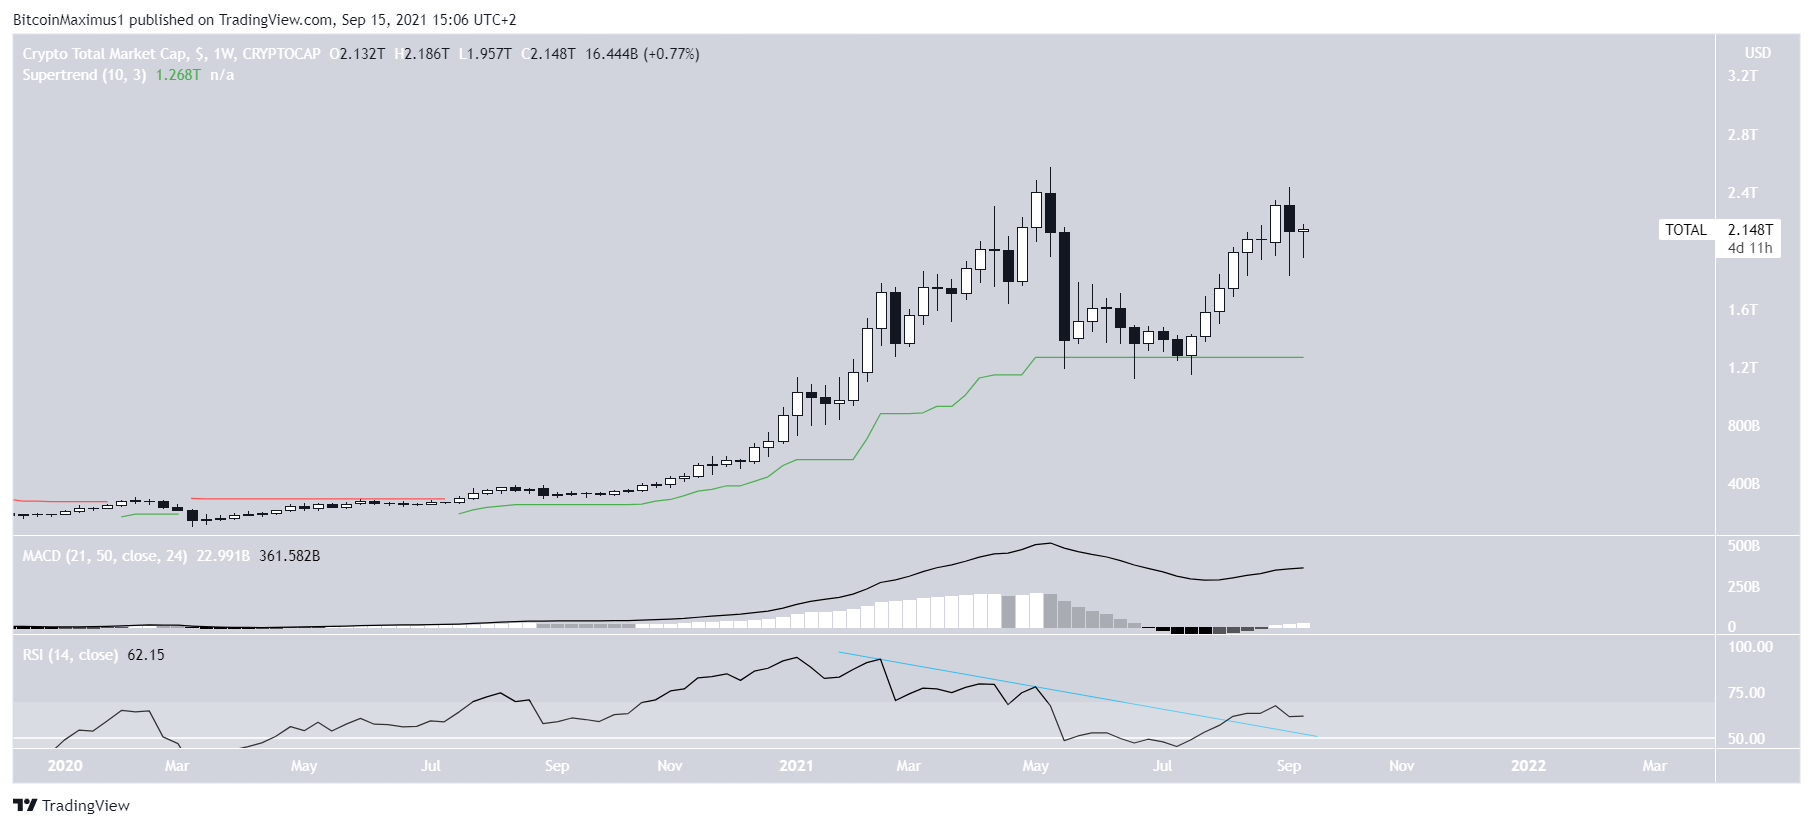
TOTALCAP is currently at $2.15 tn after decreasing considerably last week. If last week’s high holds, it would mark the first lower high since the $2.57 tn all-time high of May 12.
Technical indicators are mixed, but are leaning on bullish. While the MACD and RSI are both decreasing, the former is positive while the latter is above 50. Also, the RSI has broken the bearish divergence trendline. Furthermore, the Supertrend is bullish (green line).
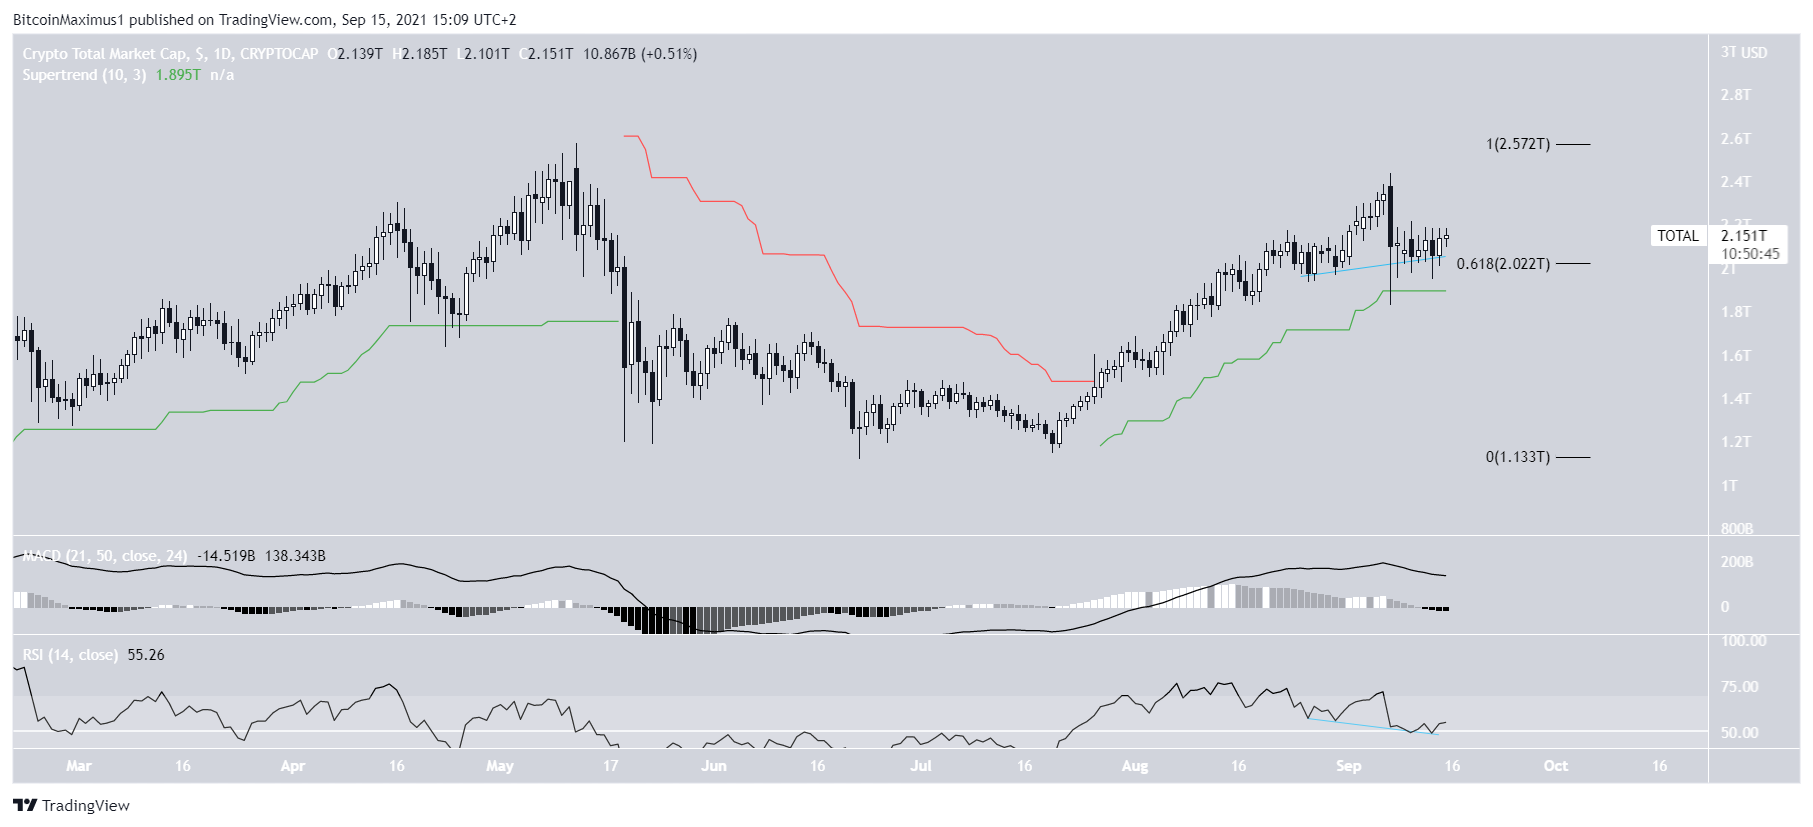
The daily chart provides a more definitively bullish outlook.
Firstly, TOTALCAP has reclaimed the previous 0.618 Fib retracement resistance level at $2 tn. It is currently in the process of validating it as support.
Technical indicators provide a bullish outlook. While the MACD is decreasing, its is still positive. In addition to this, the RSI has generated hidden bullish divergence, a strong sign of trend continuation. Finally, the Supertrend is bullish.
Therefore, the daily chart suggests that an upward movement towards the all-time highs is more likely than a drop.
Highlights
- TOTALCAP has reclaimed the $2 Trillion support level.
- Technical indicators are leaning on bullish.
ALTCAP
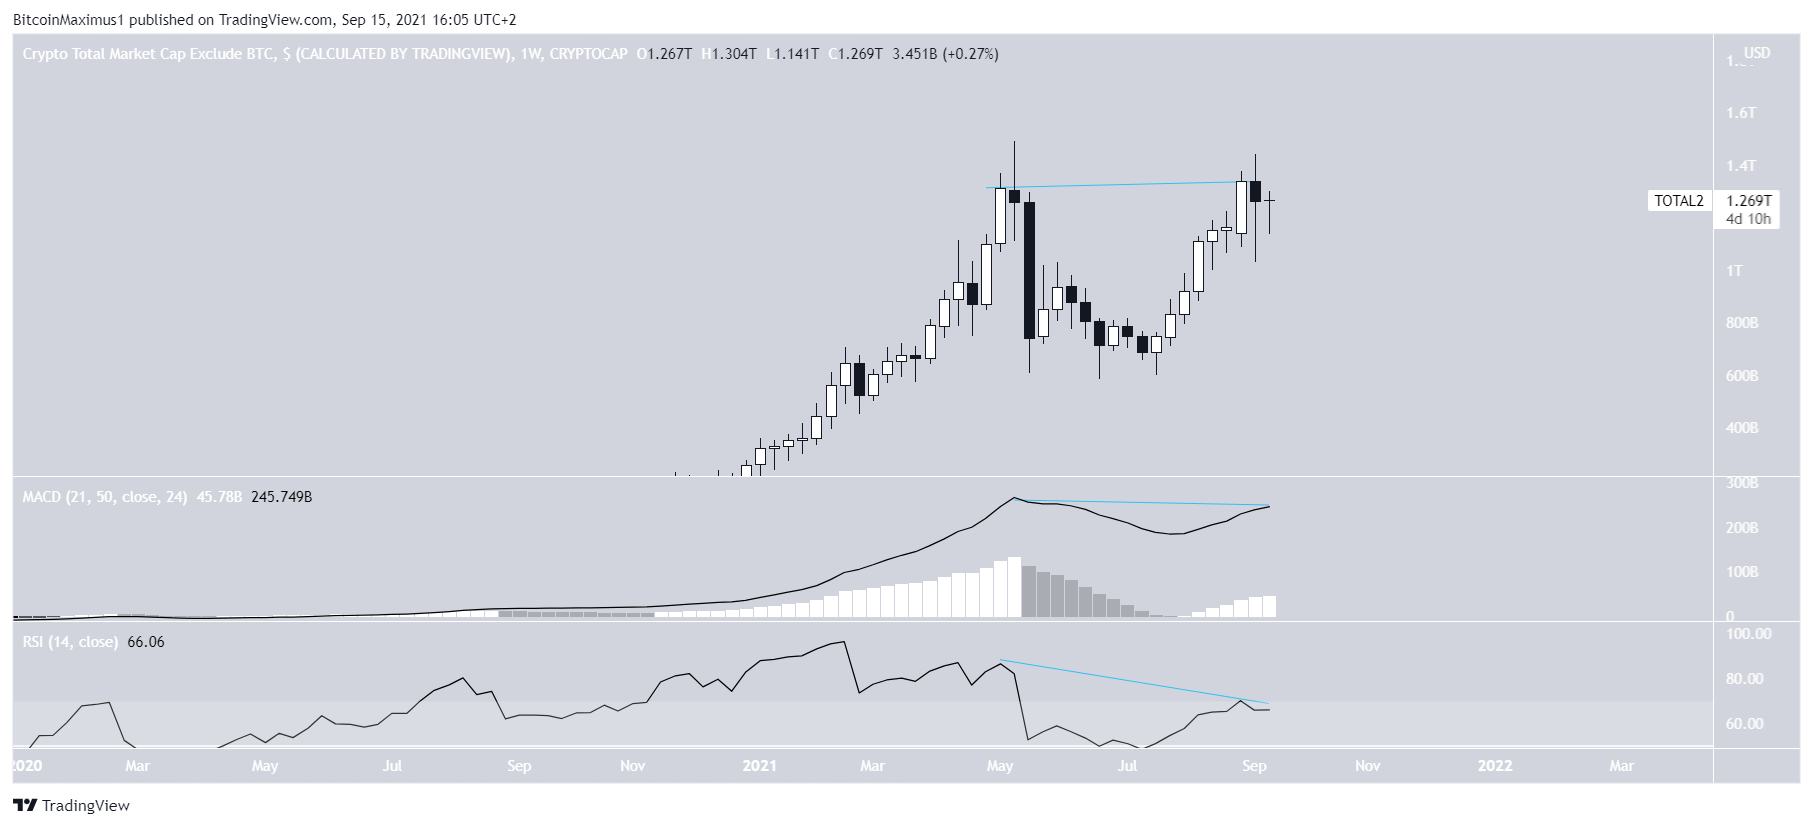
ALTCAP has increased considerably since July, nearly reaching a new all-time high on Sept 7. However, the high of $1.44 tn was only slightly lower than the $1.49 tn all-time high on May 12.
However, due to the higher weekly close, it created a double top pattern which was combined with bearish divergence in both the RSI and MACD.
Therefore, besides being a bearish pattern, the double top is combined with bearish readings from indicators.
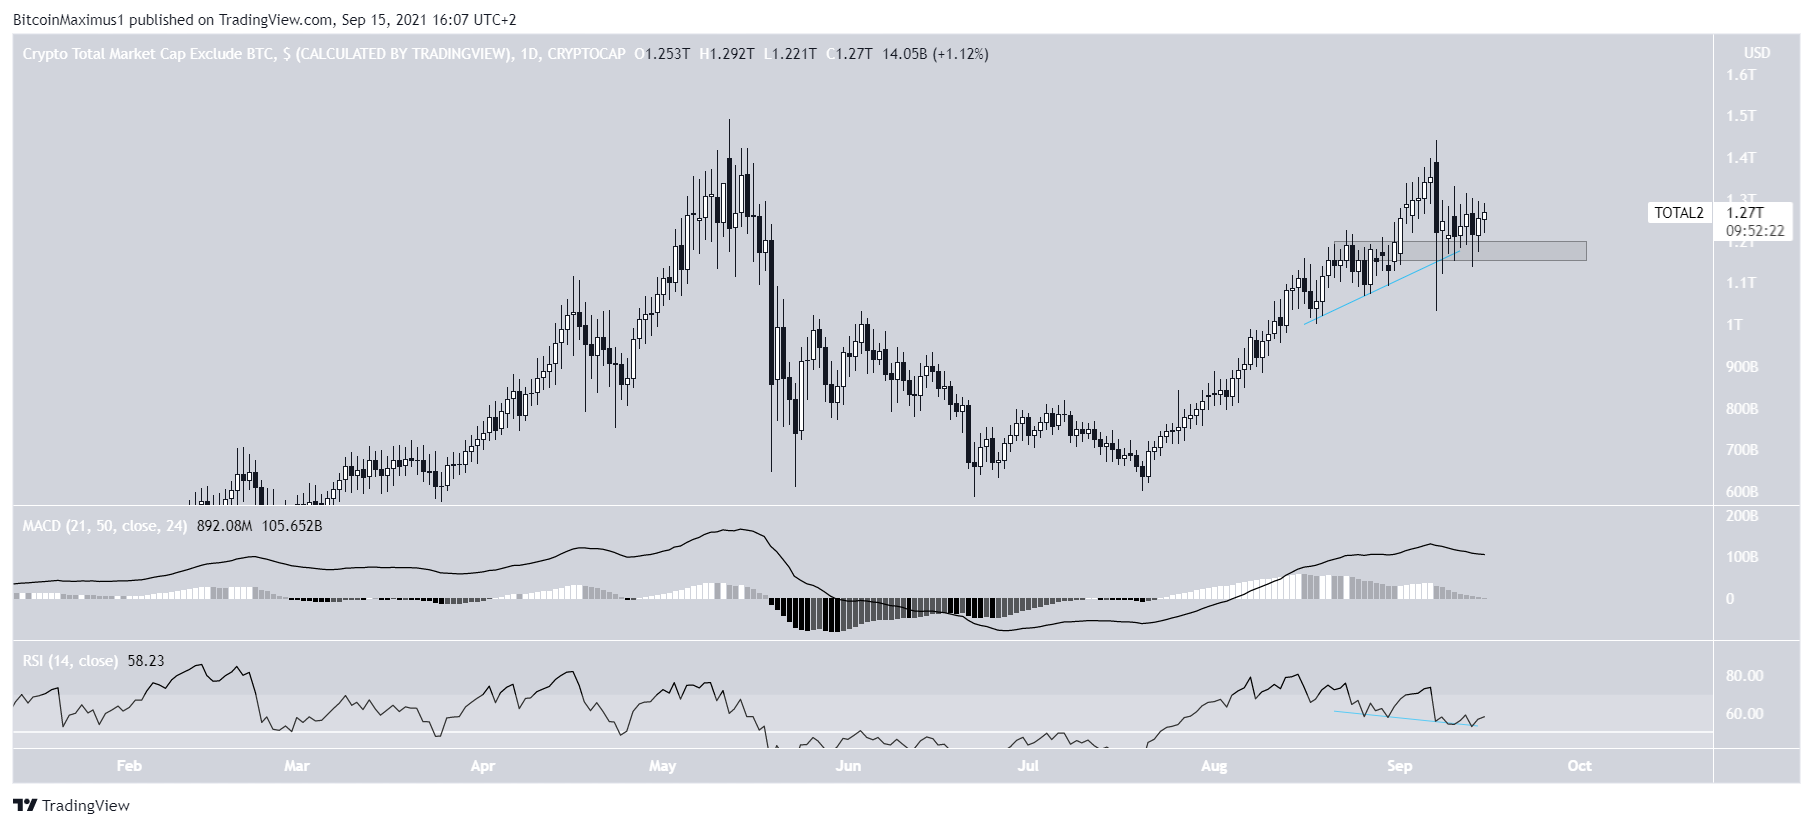
However, the daily chart is more bullish. ALTCAP is trading above the $1.18 tn support area, which previously acted as resistance.
Furthermore, there is a hidden bullish divergence developing in the RSI, a strong sign of trend continuation.
Therefore, as long as ALTCAP is trading above the $1.18 tn area, it could initiate another short-term upward movement.
Highlights
- ALTCAP has created a double top pattern
- Long-term indicators are bearish but short-term ones are bullish.
DEFIPERP
DEFIPERP has been moving upwards since June 14. It created a higher low on July 20 and resumed its upward movement at an accelerated rate.
On Aug 21, it broke out from the $11,000 area and validated it as support afterwards, creating several long lower wicks before continuing its upward movement.
Similarly to TOTALCAP, the RSI has generated hidden bullish divergence while the price has bounced at the Supertrend support line. Therefore, an upward movement towards the highs does seem more likely than a drop.
Highlights
- DEFIPERP has bounced at the $11,000 support area.
- Technical indicators are bullish.