HBAR does not use a conventional blockchain, as is the case with most other cryptocurrency platforms. Instead, “Hashgraph” brings into light a completely new novelty of distributed ledger technology. This technology has the potential to surpass many other blockchain-based alternatives in many key areas such as the trilemma of fast speed, low cost, and increased scalability. Hedera transactions are free of transaction fees with an average cost of $0.0001 and usually reach finality within five seconds.
Hedera Hashgraph claims to be able to handle more than 10,000 transactions per minute (TPS), as opposed to the 5-20 that are required by most proof-of-work (PoW) based blockchains.
Past Performance of HBAR
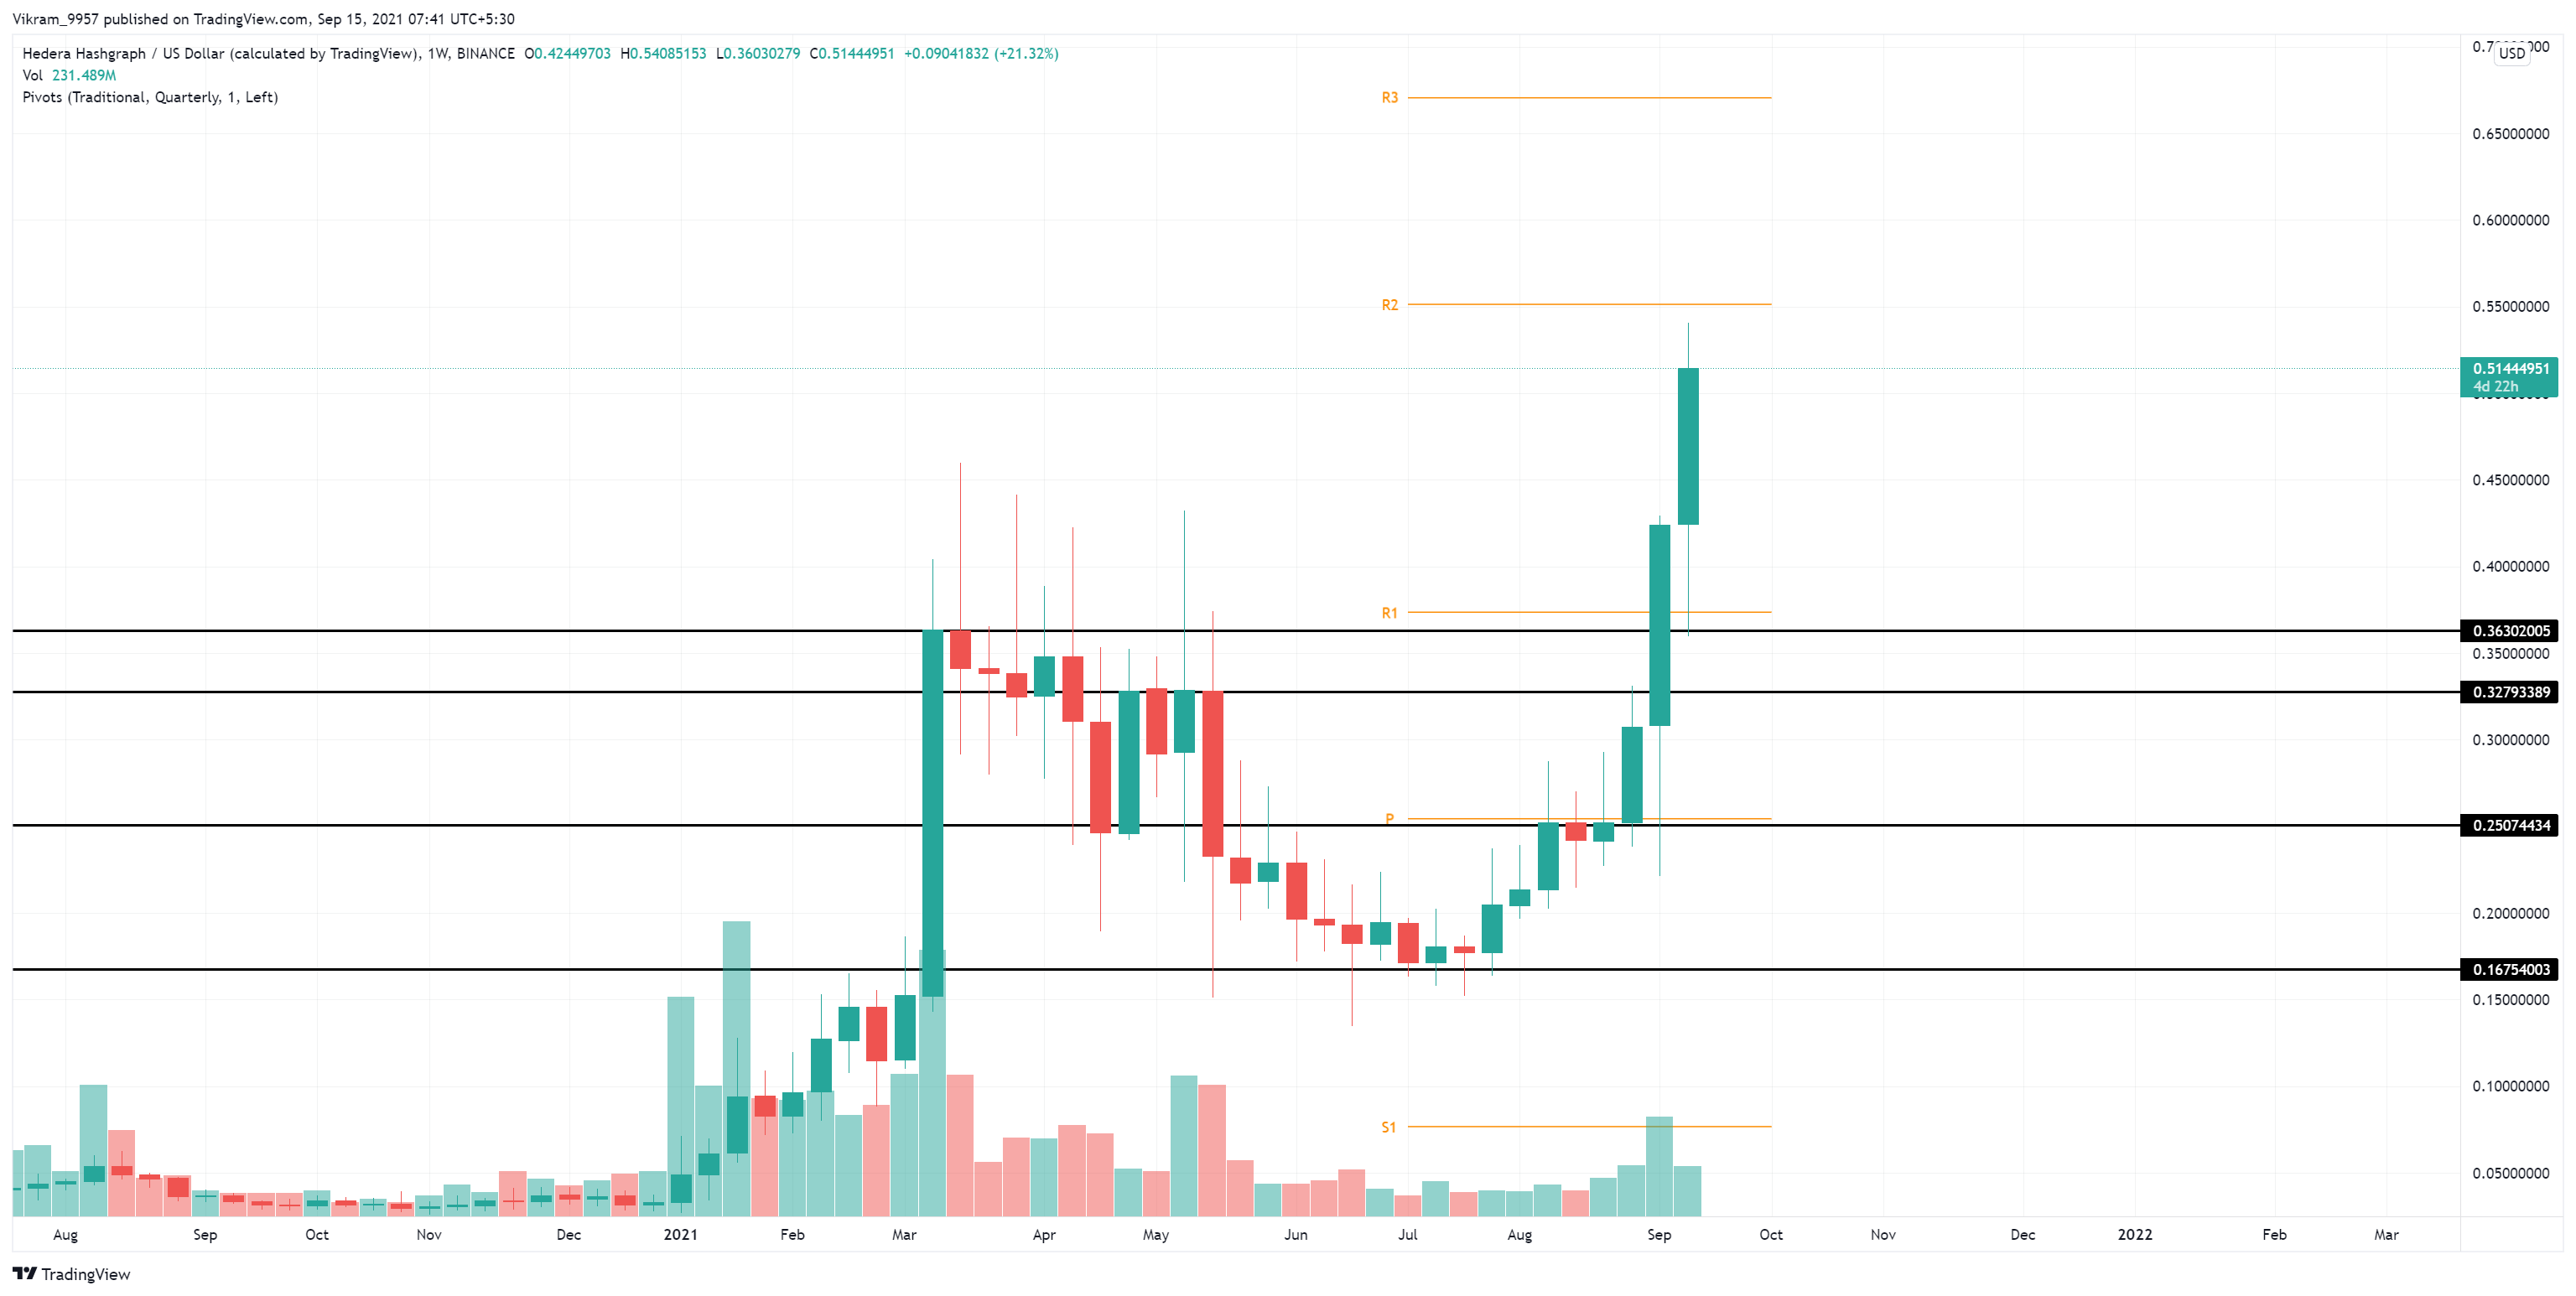
The HBAR coin price is riding on a long bullish rally helping in the recent all-time high formation of $0.54. This was possible due to the recently made bullish engulfing candlestick in the weekly chart with a gain of 22%.
The breakout of the resistance level at $0.36 resulting in increased underlying bullishness. However, the price may soon retrace to complete the retest.

Source - Tradingview
HBAR Technical Analysis
The HBAR coin price is trading at $0.5119 at the time of writing, with a bullish increment of 24.47% in the past 24 hours. Thus, making a long bullish candle in the daily and weekly chart as well.
The token price broke the critical resistance zone near the $0.36 mark, which is yet appropriately retested. However, the chances of a retest are meager due to the overwhelming increase in the buying volume, evident by the trading volume rising higher than the 20-days MA of volume.

Source - Tradingview
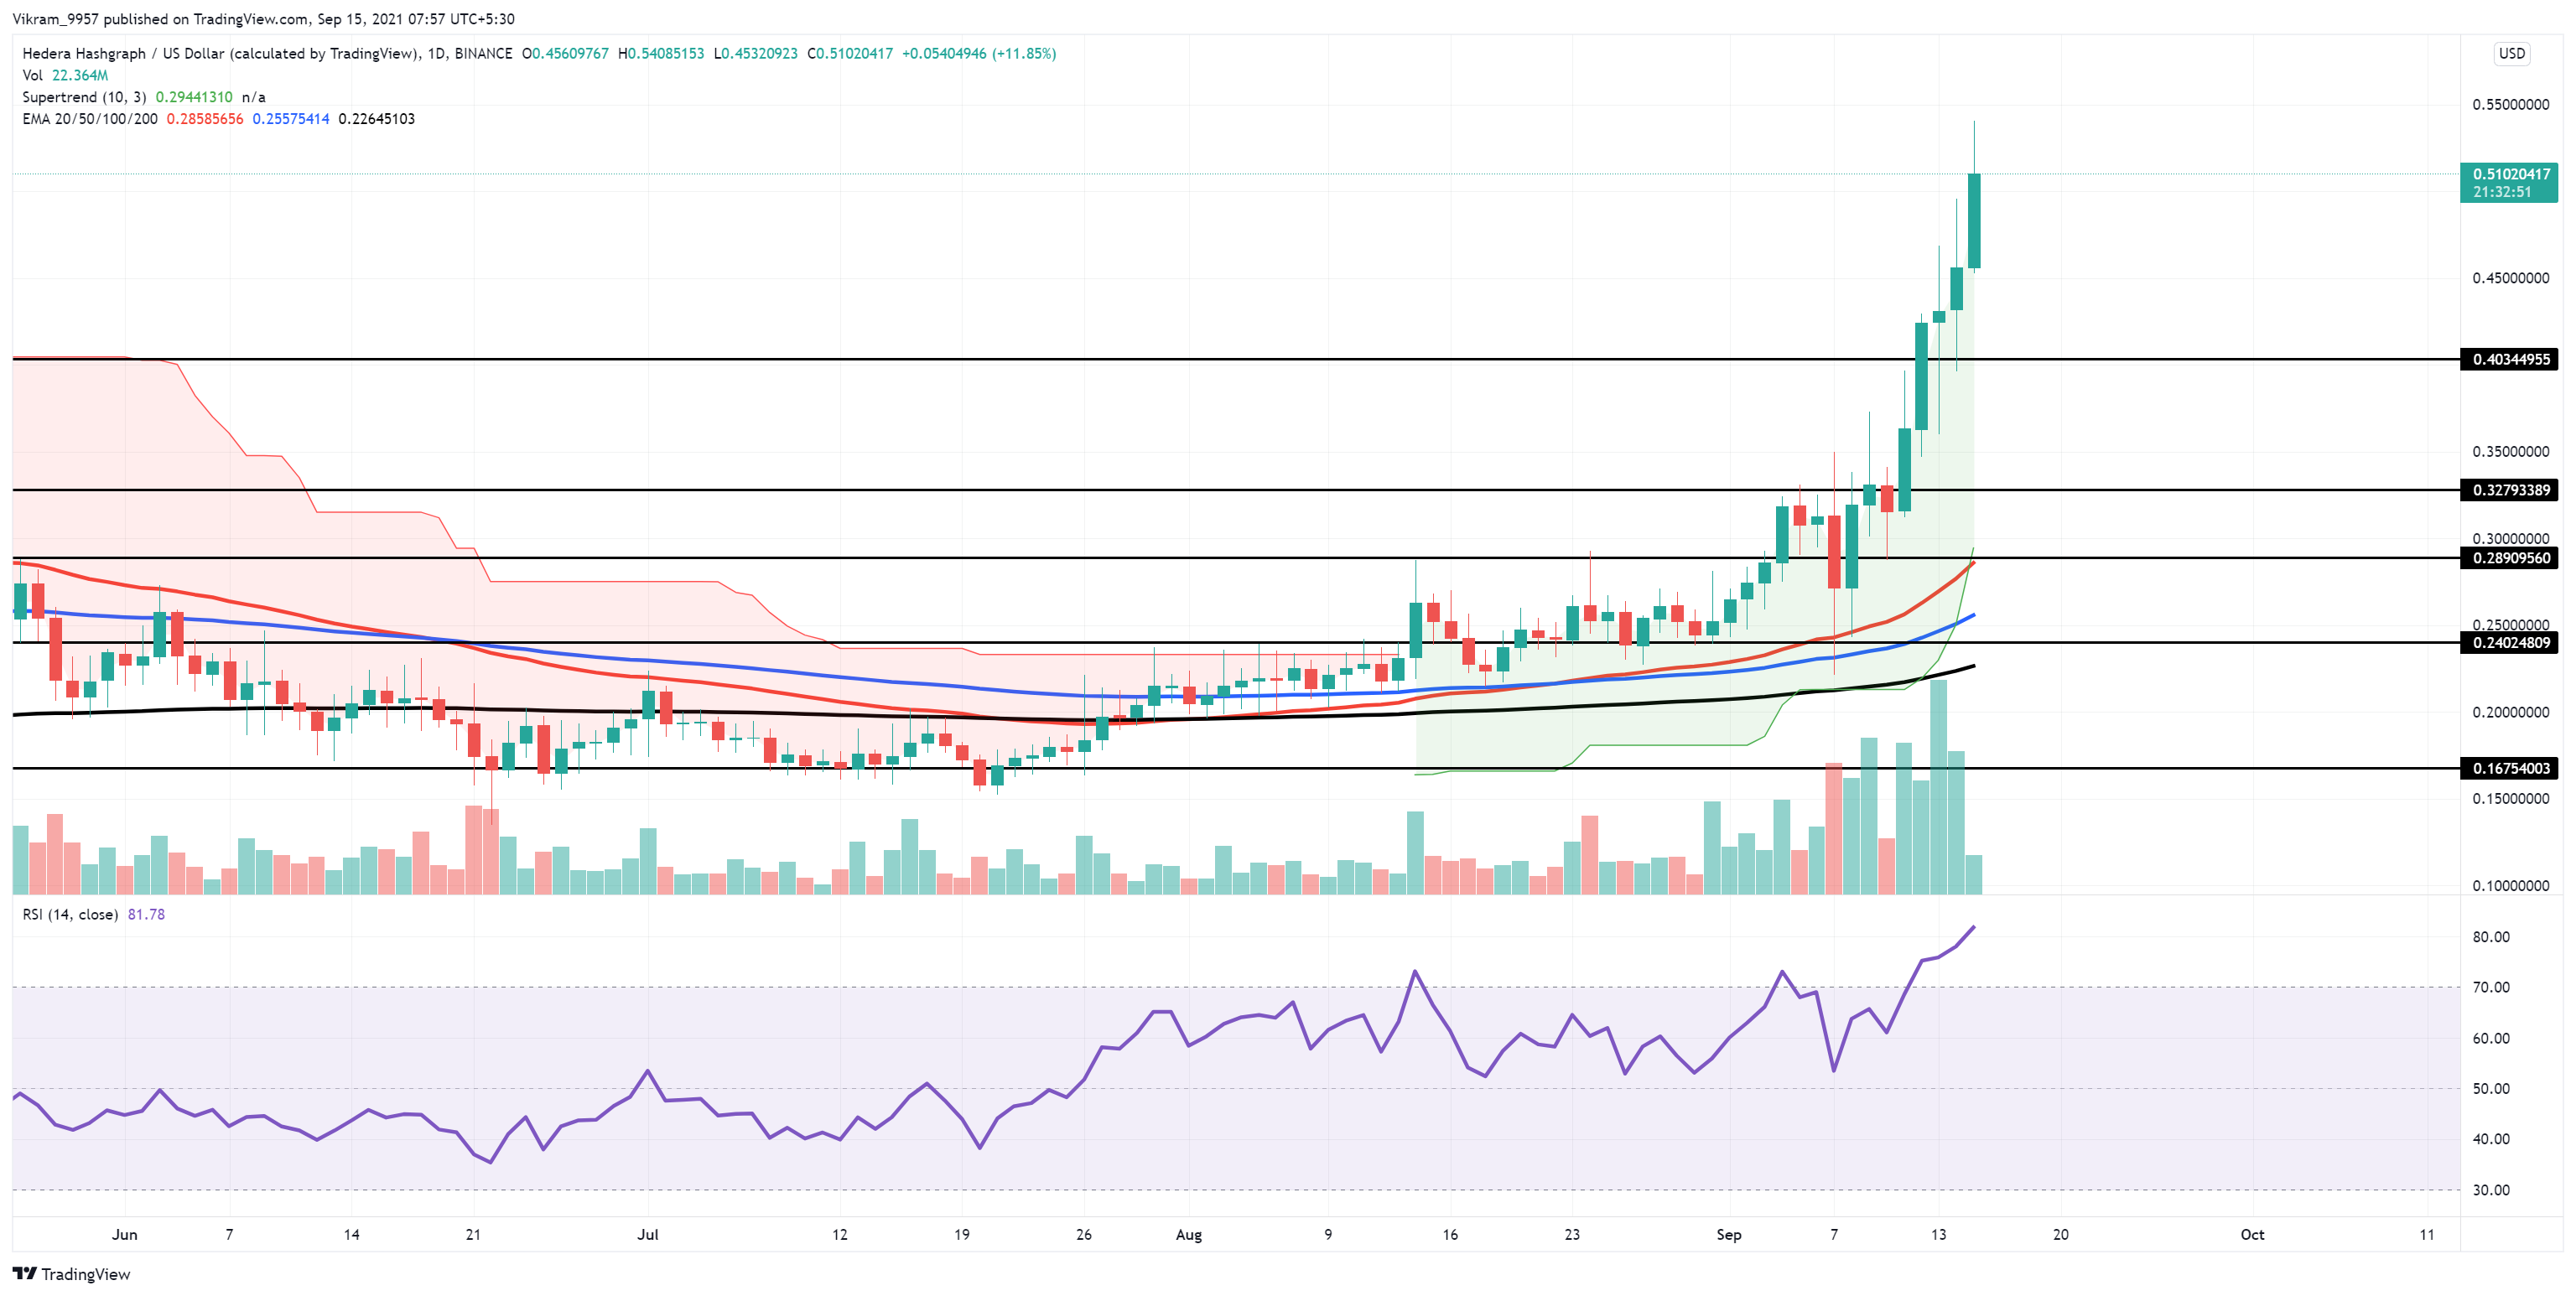
In the daily chart, the HBAR token price breaks above the critical resistance level of $0.36. However, it continues to rise higher with increasing underlying bullishness evident by the formation of long tails. This may promote lower price rejection.
As per Newton’s third law, every action has an equal and opposite reaction, which implies that the increased buying seen currently in the HBAR could lead to a retracement soon.
The RSI indicator currently represents growth in underlying bullishness as the RSI slope spikes up to enter the overbought territory. This produces a sense of solid buying among investors and traders.
Also, the super trend indicator projects an uptrend in motion as the price trades above the indicator’s line.
In a nutshell, the price trend indicates an ongoing bullish rally with no signs of weaknesses yet.
Day-Ahead and Tomorrow
HBAR coin price could continue to rally above the resistance levels of $0.55 or $0.80 before facing any severe selling pressure. On the other hand, the support levels are at $0.45 and $0.30 as per pivot points. Also, the rising EMAs in the daily chart can support the prices in case of a downfall.
 cryptoknowmics.com