Blockchains need to be able to securely handle millions upon millions of transactions if they wish to host the mainstream applications used daily by hundreds of millions of people. This is where IOST (Internet of Services Token) comes in. The team is building a blockchain that can handle real use and real volume.
IOST claims it can process up to 100,000 transactions per minute. This is significantly more than its competitors like Ethereum's 20, Tron’s 2,000, and EOS’s 4,000.
IOST boasts a high number of dapps as well as dapp users. This is quite impressive given that IOST is still relatively new compared with the other blockchains in the "Big 4."
IOST's team is working hard to improve dapps and dapp usage, as well as increase their partnerships. They will continue to work with more exchanges and bring more developers and Nodes into their ecosystem. That can make it the "world's most scalable and decentralized Blockchain project."
Past Performance of IOST
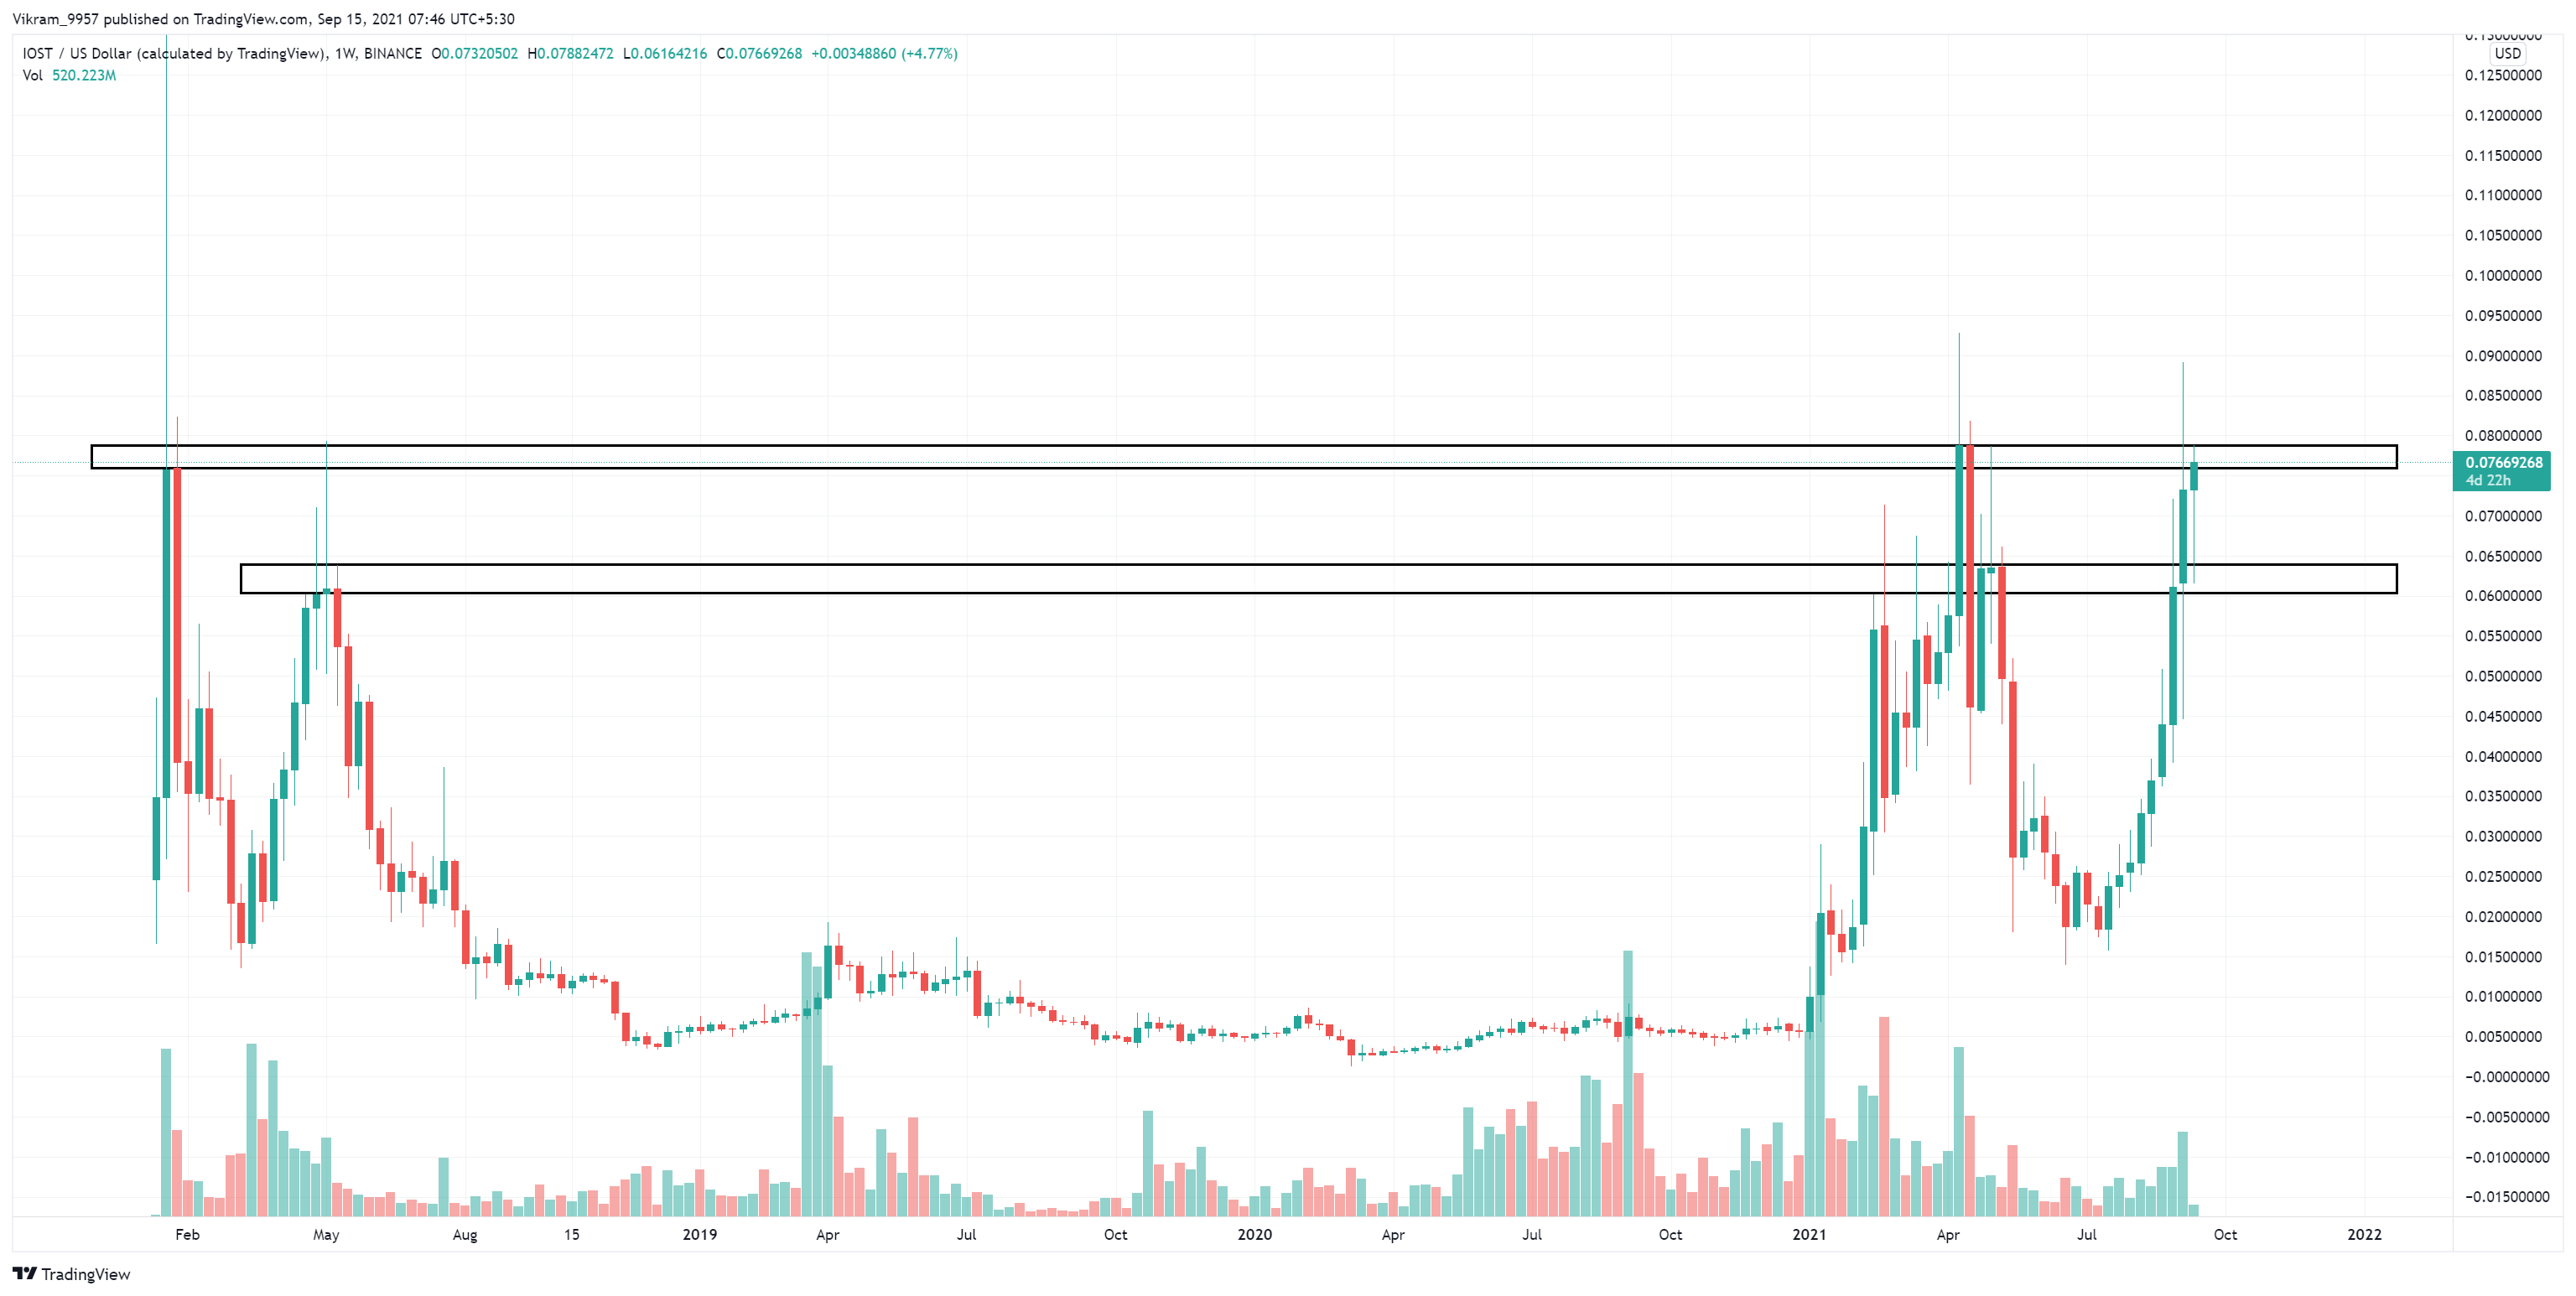
The IOST coin price is riding on a long bullish rally that has helped in the price reaching near the crucial resistance level of $0.080. However, upon reaching the resistance the underlying bullishness seems to have exhausted, increasing the chances of a short-term retracement. The breakout of the resistance zone near the $0.080 mark could increase the underlying bullishness exponentially, however, the price may soon retest the zone before continuing the bullish rally.

Source - Tradingview
IOST Technical Analysis
At the time of writing, the IOST cryptocurrency price is $0.07666. There has been a 16.07% increase in the last 24 hours leading to the formation of a bullish green candlestick in the daily and weekly charts.
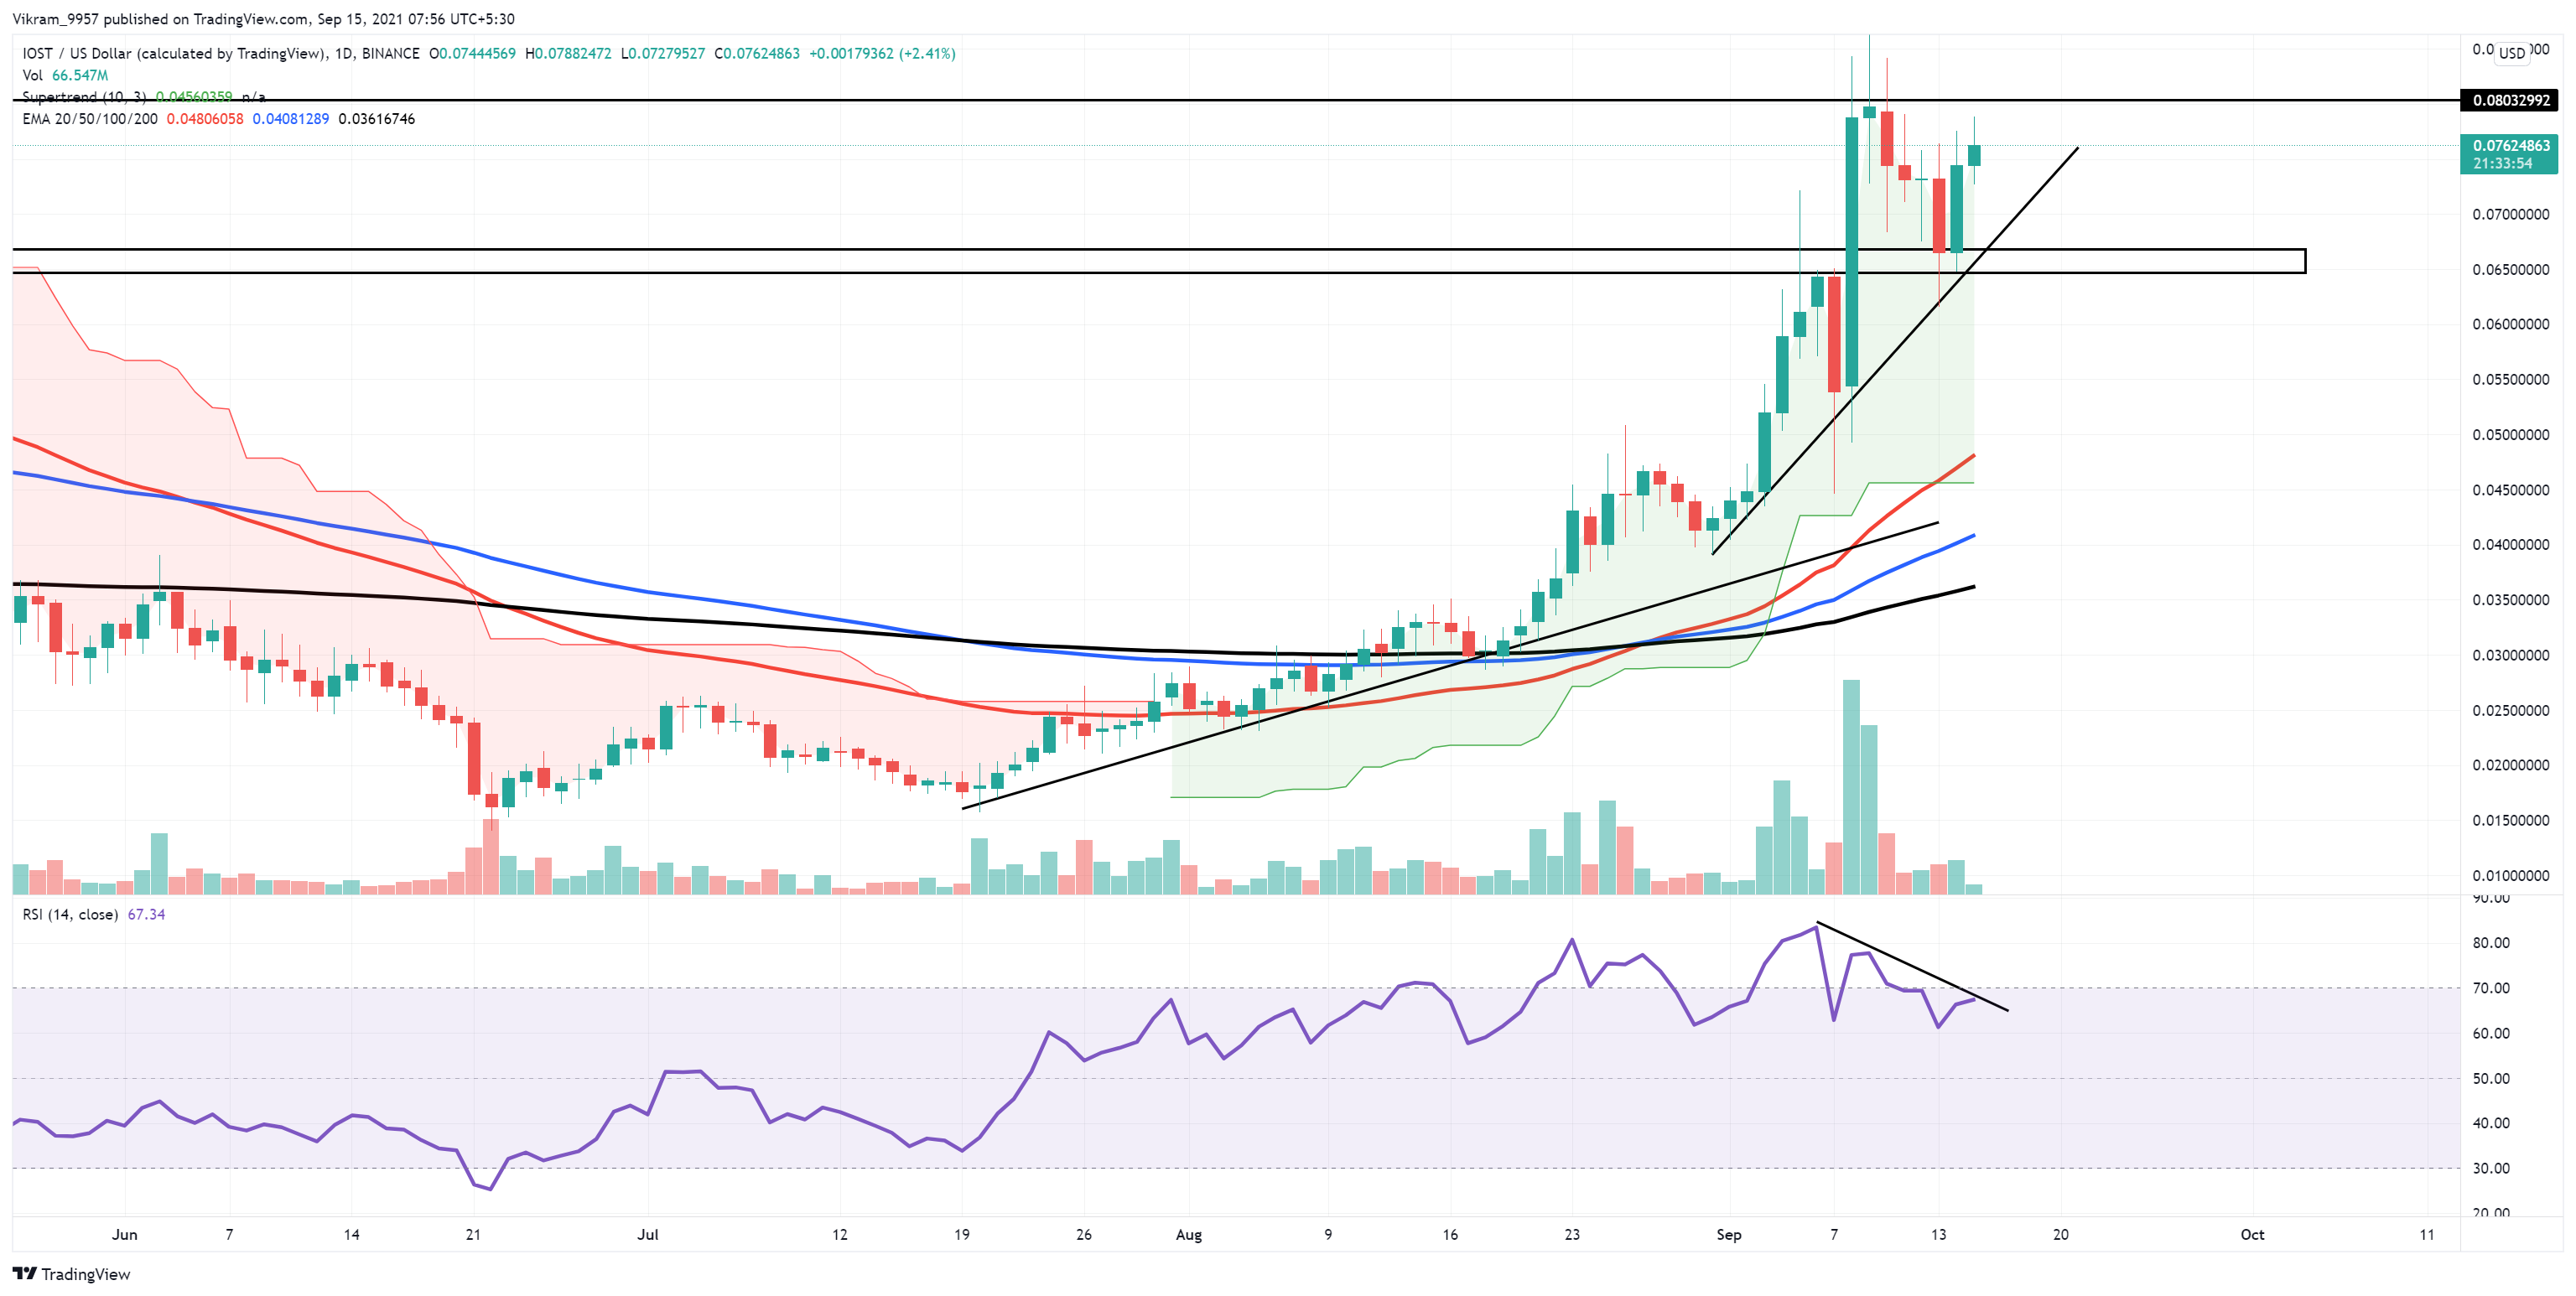
Referring to the weekly chart: The token price trades in the vicinity of the $0.080 mark. This resistance zone has not been broken and sustained since the launch of IOST. The daily chart's RSI shows bearish divergence signs, so the chances of success are slim.

Source - Tradingview
In the daily chart, if the IOST token price breaks above the key resistance level of $0.080, it may find an overwhelming supply. This could lead to a higher price rejection resulting in a long wick formation.
However, it is also plausible that the price could test the support trendline before finding the demand to sustain above the $0.080 mark. Nonetheless, the decreased trading volume between the $0.065-$0.080 zone may shortly decide the future trend as bearish.
As per the super trend indicator, the crypto asset trades in an uptrend after finding overwhelming demand near the solid support level of $0.015. This has resulted in a bull run of more than 300%.
The RSI indicator currently indicates a weakness in underlying bullishness as the slope of this indicator falls back to neutral territory. It is indicating weakness and generating a bearish divergence in the slope of the indicator and price, which could lead to a downfall.
Adding all the indications from the price action and the indicators, we can see the overall picture as bullish, but the underlying bearishness increases in a shorter time frame. This could lead to a retracement before the breakout.
Day-Ahead and Tomorrow
Currently, the IOST price is trading below the crucial resistance level of $0.080, with a decrease in trading volume representing a lowering interest of traders. However, the retracement could bring a boom in demand that can help the price to sustain above the $0.080 mark.
In the case of a Bullish Breakout, the resistance levels above $0.080 are at $0.10 and $0.12. However, the support levels in case of fallout are at $0.065 and $0.050.
 cryptoknowmics.com