Axia Protocol is a decentralized platform for Cryptocurrency Index Fund management that presents cryptocurrency enthusiasts and investors with opportunities for one-time investments in baskets of cryptocurrencies (Axia Funds) and reap rewards for doing so. Let us look at the technical analysis of AXIA.
Past Performance
On September 08, 2021, AXIA started trading at $0.16. As of September 14, 2021, the closing price of AXIA was $0.71. The volatility has been high this week. In the last 24 hours, AXIA has traded between $0.27-$0.85.
https://www.tradingview.com/x/HshcYw7P/
AXIA Technical Analysis
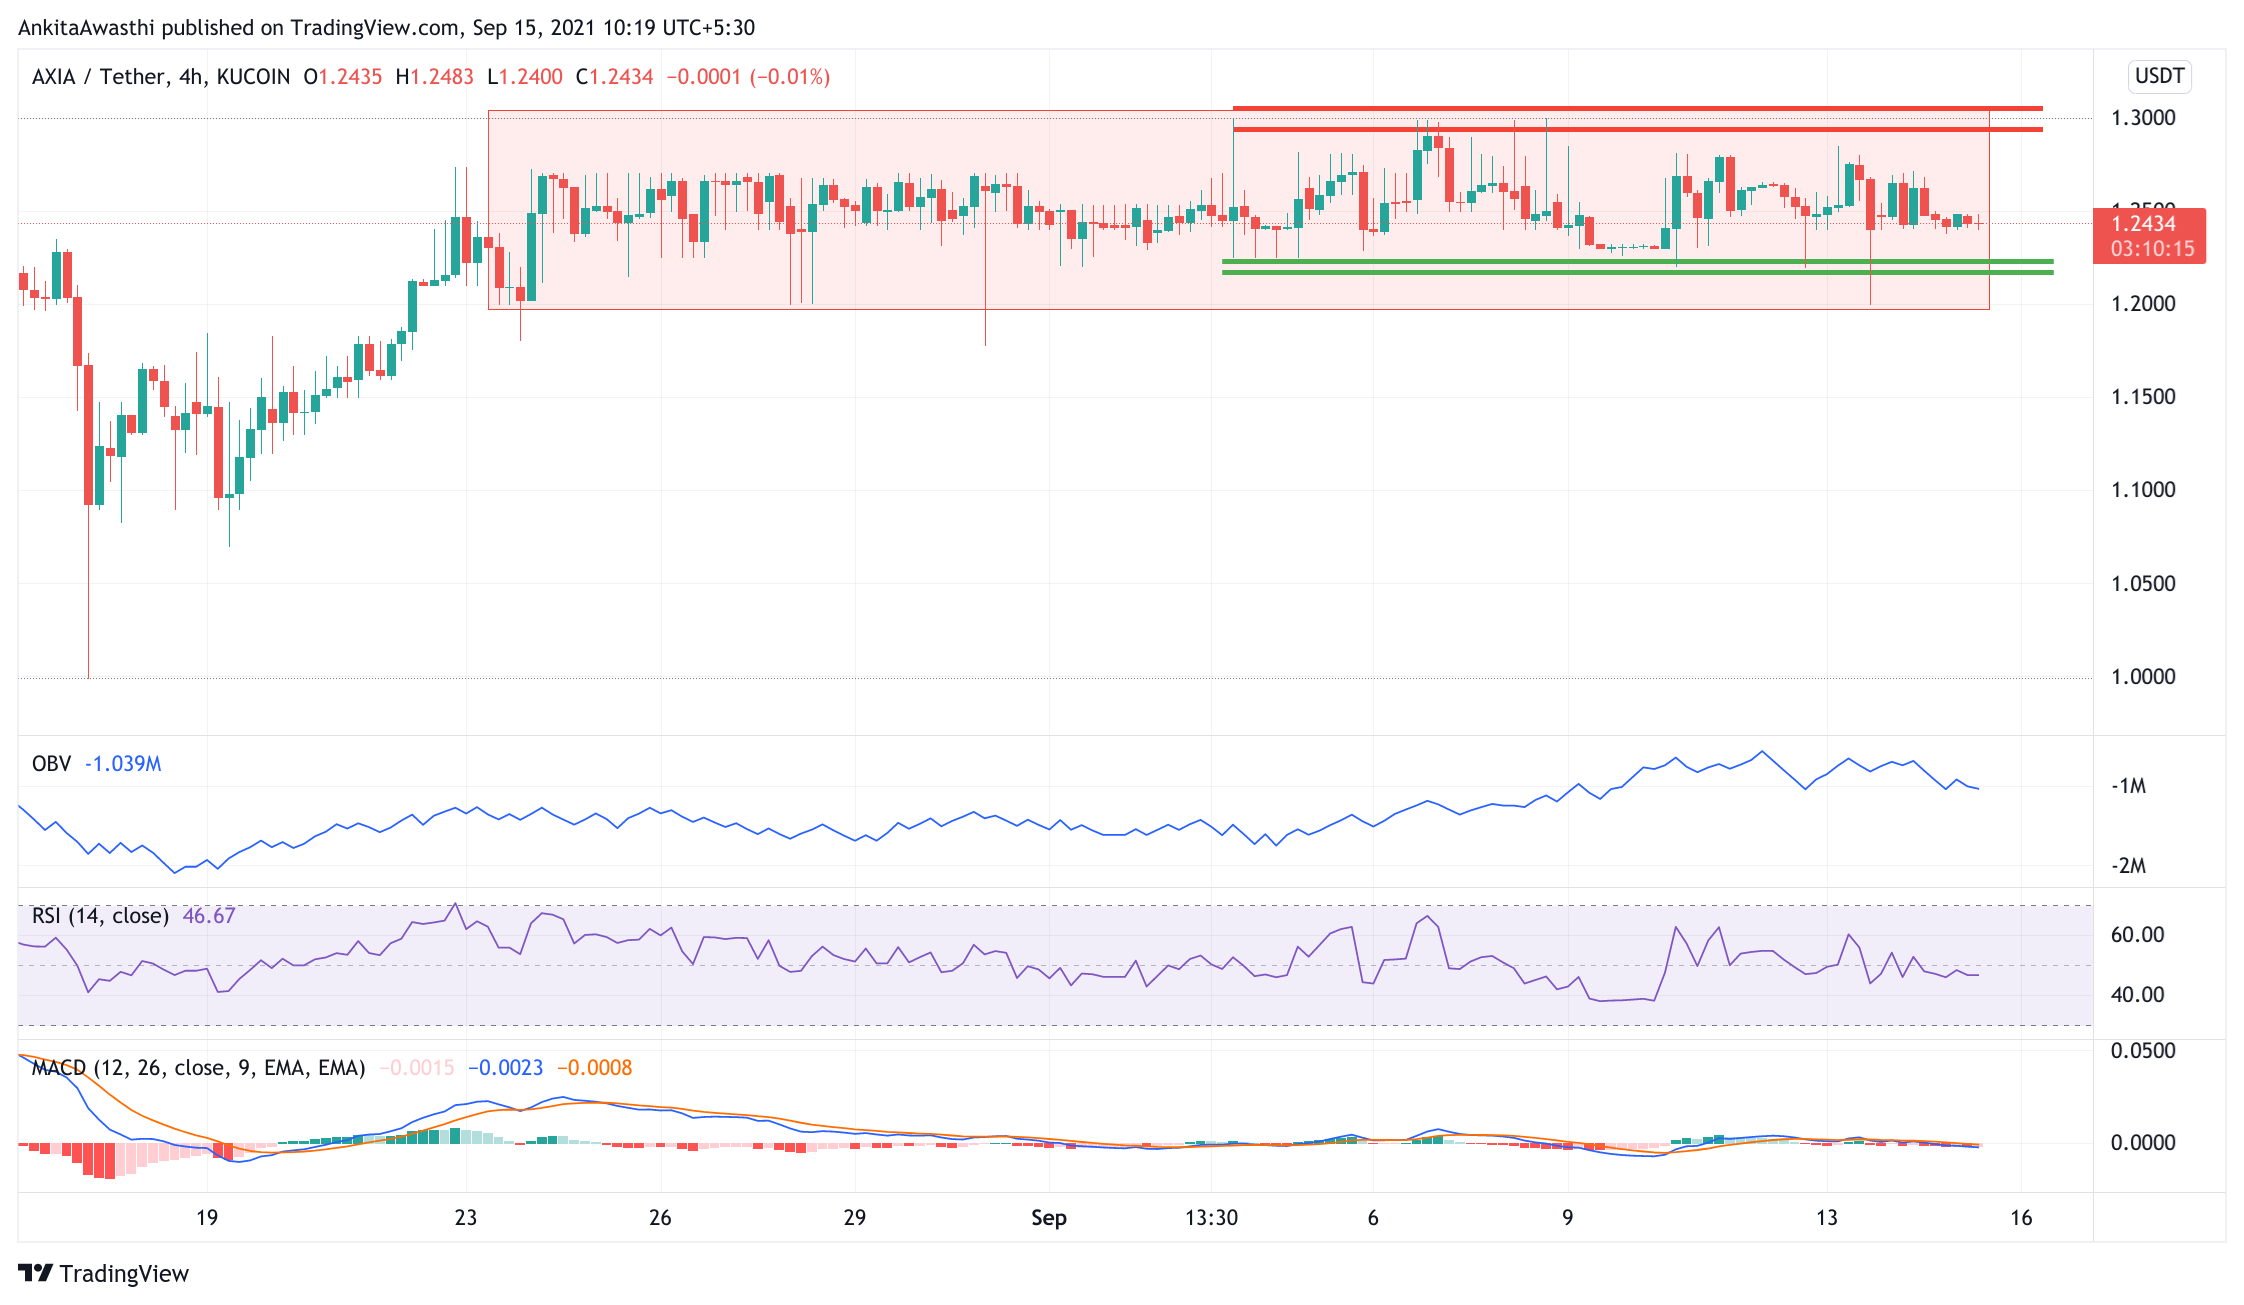
The price has been trading in the same range since the starting of August. A breakout on either side will predict the trend of AXIA. Until then, traders can earn by scalp trading between the bottom and top trend line of the range. Let us have a look at the reasoning;
AXIA is considered as the new reserve token of the world. The volatility in the coin has increased in the past few hours. We can predict AXIA to make new highs on a daily level.
At the time of press, AXIA is trading at $0.70. It is up by approximately 159.65% from the days’ opening price. Indicating high buying pressure. Therefore, the market momentum seems bullish for the day. The price can test the resistance level of $1.27 soon.
Also, on the daily chart, the MACD and signal lines are moving under the zero range. However, a bullish crossover by the Signal line over the MACD can be seen. Thus, indicating a rise in the price.
However, the lines are near to the zero range. Trend reversal might be on the verge. Therefore, we have to wait and watch if the bulls get active and the buying pressure takes on the selling pressure. In that case, the price can break its immediate resistance level at $1.24.
The RSI indicator is at 44.85%, which is making a bearish divergence and constantly falling from the level of 54% mark. Thus, if the sellers remain strong for the rest of the day, it will break the support level and fall. Hence, we can expect the RSI to take the support and the price will fall for some time.
Day-Ahead and Tomorrow
AXIA is currently trading below the pivot level of $1.24. As the indicators are showing high selling pressure, thus, we can expect the price to fall and soon, take the support of the Fibonacci level of $1.23. If it breaks down from this level of $1.22, it can retest the long-term support level at $1.21.
In case the buying pressure takes over the selling pressure, then after breaking its resistance at $1.24, the price will highlight the next resistance at $1.27. Traders can take a long position accordingly.