NEO’s aim is to make finance decentralized for the upcoming generation and revolutionize the digitized economy. It was China's first-ever public blockchain, which was introduced in the year 2014. Constant development in the technology is NEO’s key selling point as the new technology NEO 3.0 focuses on a greater number of transactions per second. Let us look at the technical analysis of NEO.
Past Performance
On September 06, 2021, NEO opened at $65.78. On September 12, 2021, NEO closed at $51.59. Thus, in the past week, the NEO price has decreased by approximately 21.63%. In the last 24 hours, NEO has traded between $48.61-$51.87.
https://www.tradingview.com/x/WJruznXG/
NEO Technical Analysis
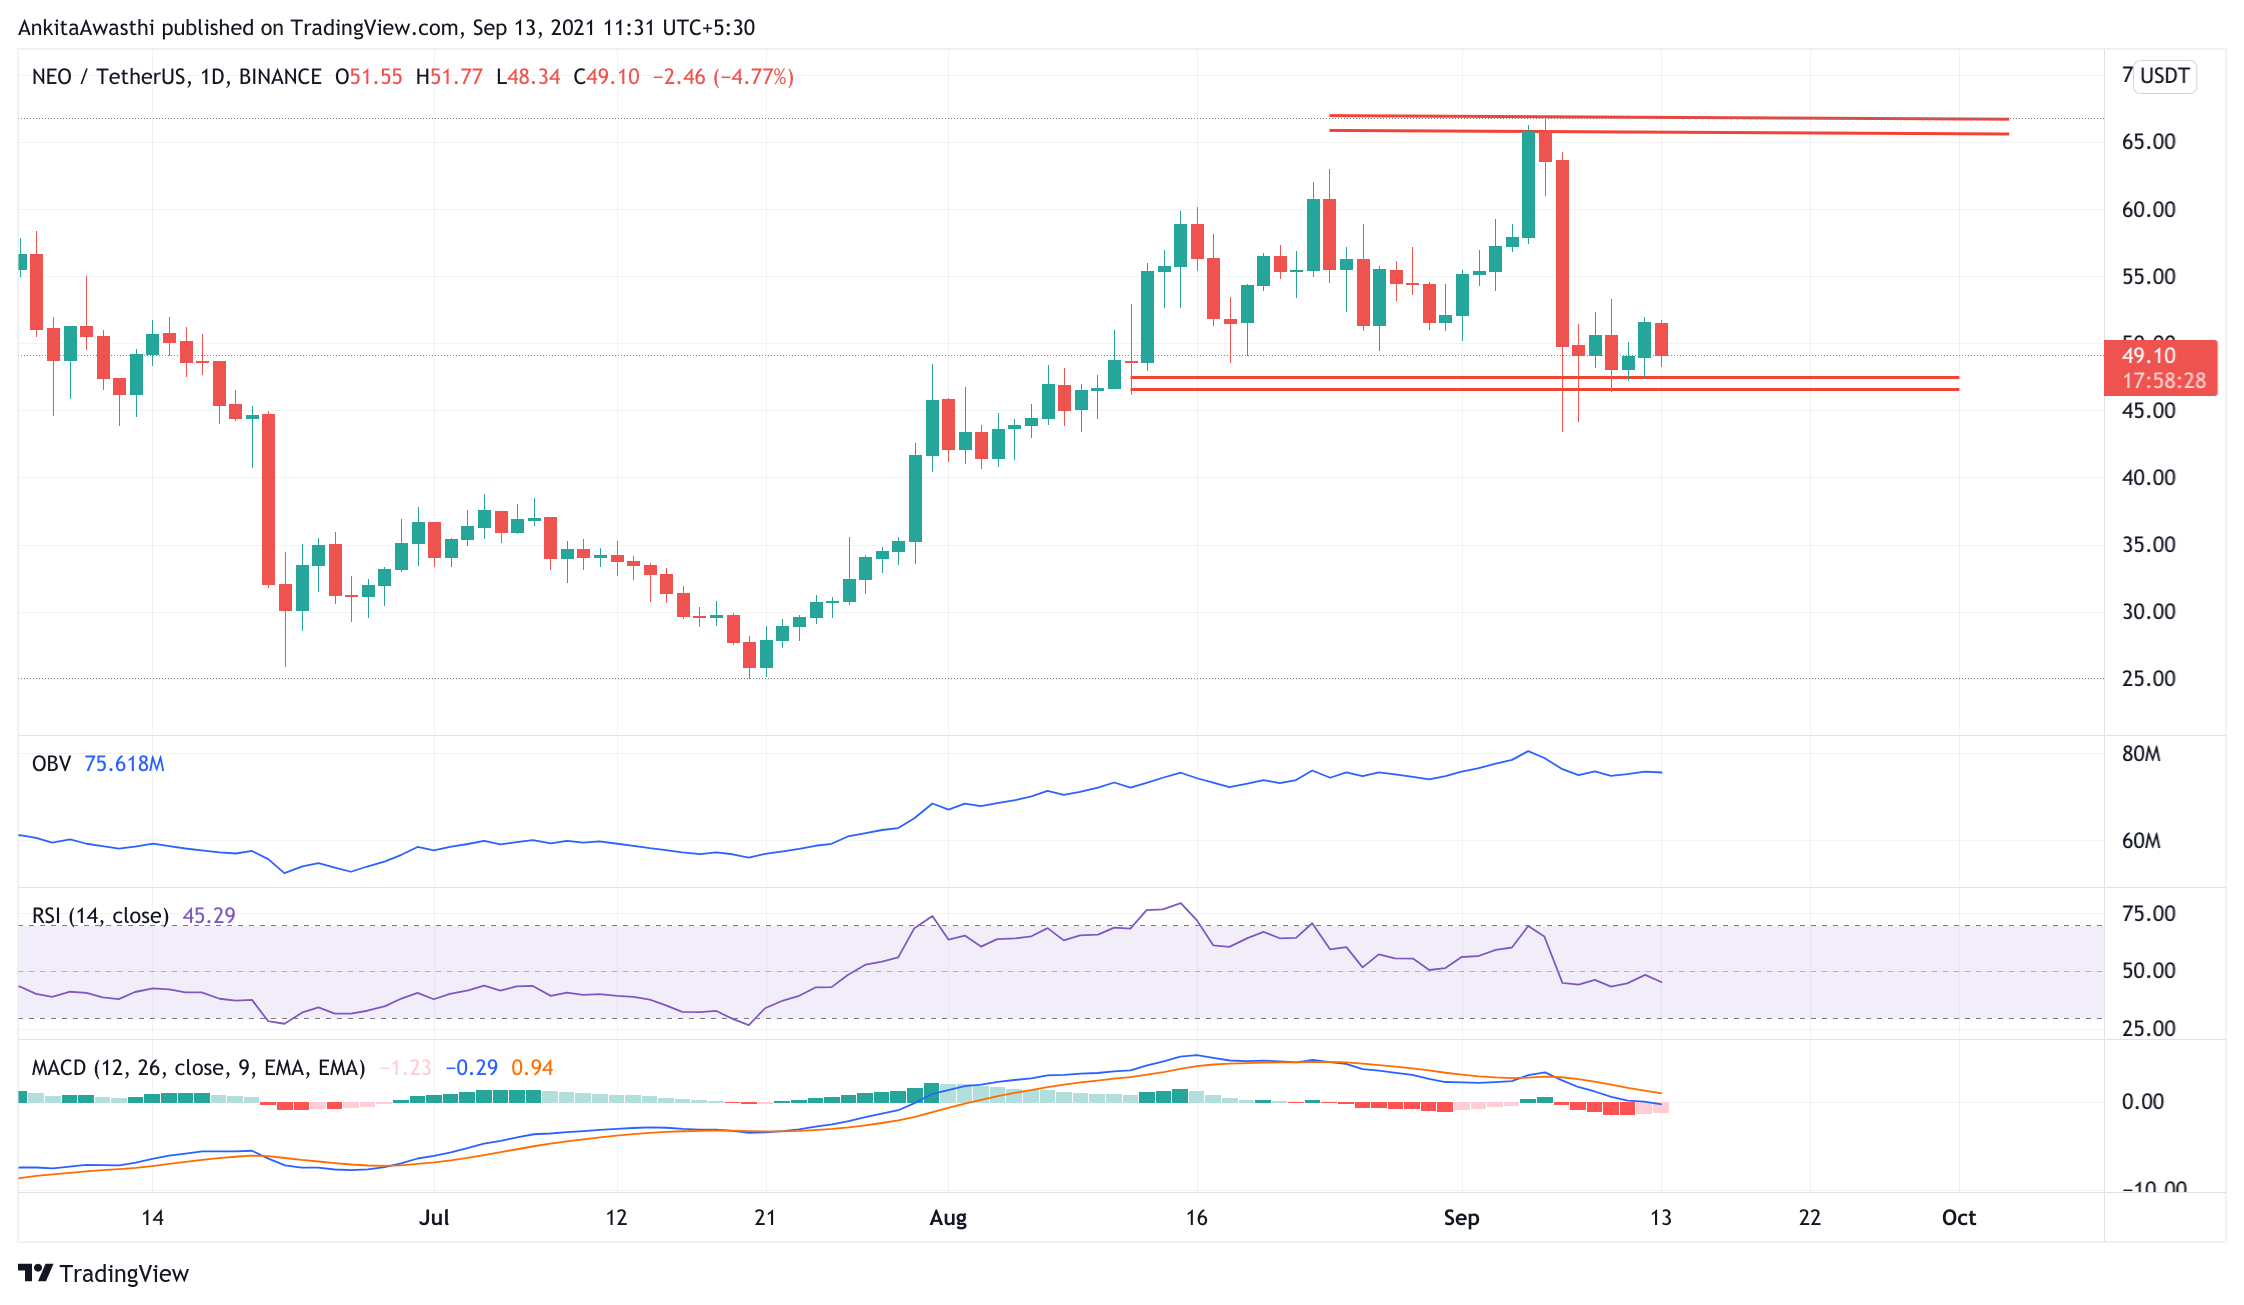
Currently, NEO is trading at $49.01. The price is slightly lower than the opening price. Thus, the selling pressure in the market seems strong.
The MACD and signal lines are in the positive zone. However, a bearish crossover by the MACD line over the Signal line has occurred. Thus, the overall market momentum is bearish. Hence, the price may fall from its recent levels.
Currently, the RSI indicator is at 45%. It faced rejection at 50% and fell back to this level. Thus, selling pressures are slowly mounting.
The OBV indicator is currently rising upward. Thus, buying volumes are dominating the selling volumes. High buying activity will neglect the downside pressure on the NEO price, and it will continue to rise.
In short, when we look at all three oscillators, we can say that the price may fall for the rest of the day. However, we cannot rule out the possibility of a trend reversal. We have to wait and watch to see if the price continues to fall in the negative trend.
Day-Ahead and Tomorrow
Currently, the NEO price is below the Fibonacci pivot point of $60.01. If the selling pressure remains strong till the day's end, then the price is likely to break the support level at $49.82 and will highlight the next support level of $43.50, according to FIB.
On the upside, if the price breaks the resistance level at $53.56. It will highlight the next resistance level at $57.05. Then, traders can take a long position accordingly.