The Graph (GRT) is an indexing protocol, available for the developers, that helps in powering up applications in both the DeFi and Web3 ecosystem. Anyone can build a “subgraph,” which is an API that anyone can build and publish using The Graph (GRT). Let us look at the technical analysis of GRT.
Past Performance
On September 03, 2021, GRT opened at $0.91. On September 10, 2021, GRT closed at $0.80. Thus, in the past week, the GRT price has decreased by approximately 12.36%. In the last 24 hours, GRT has traded between $0.78-$0.89.
https://www.tradingview.com/x/kqvXhNYb/
GRT Price Analysis
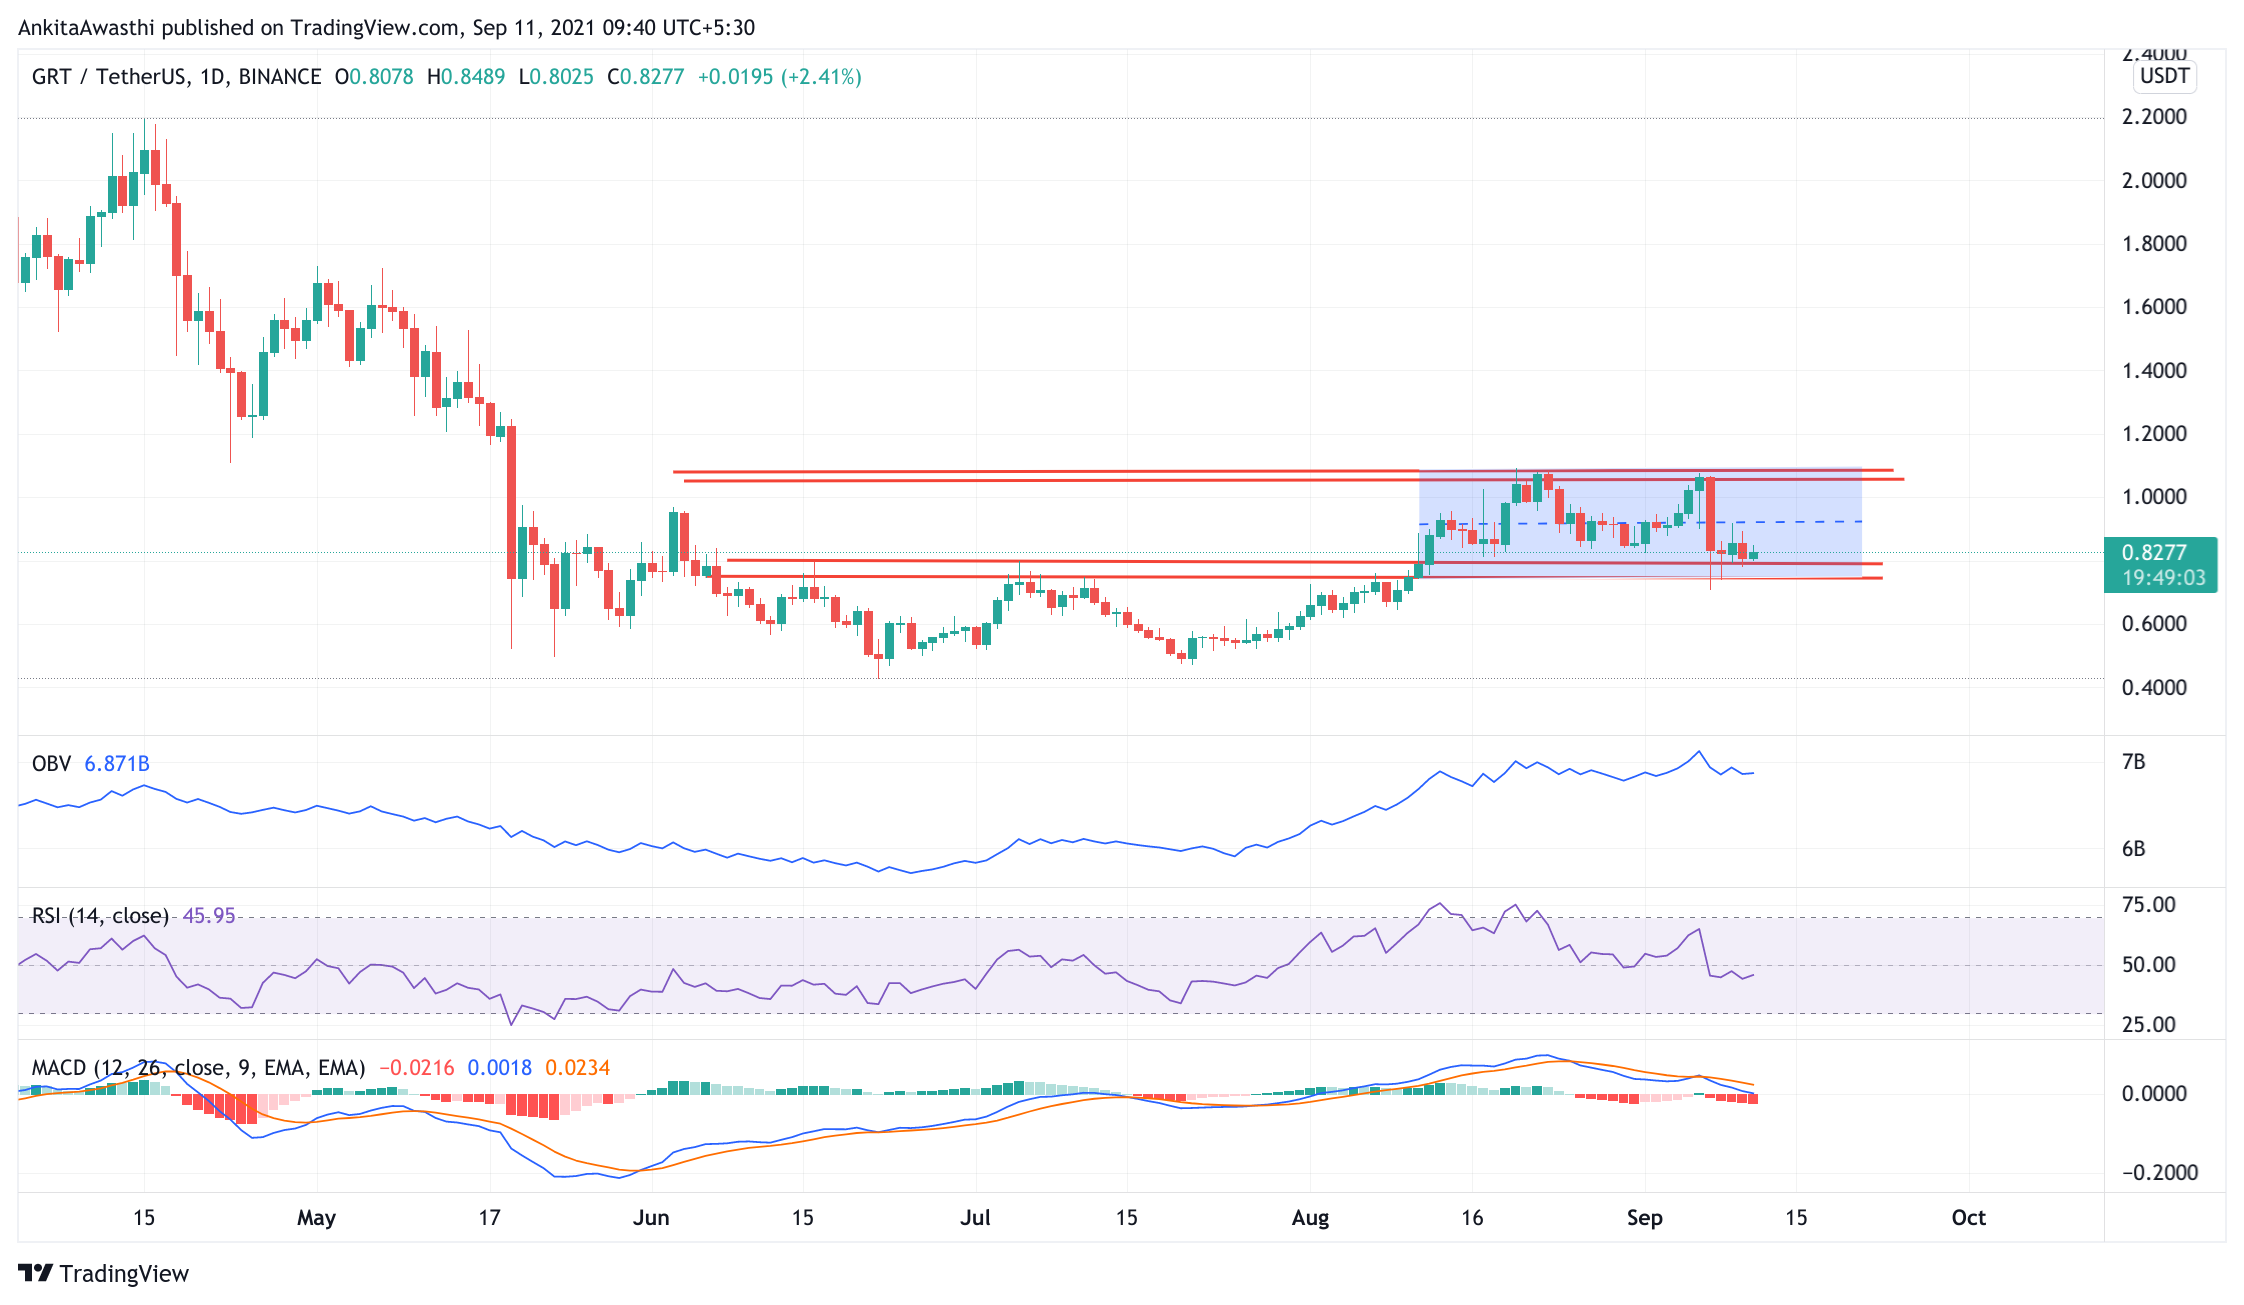
Currently, GRT is trading at $0.82. The price has increased from the day’s opening price of $0.80. Thus, it seems the buying pressure is back. However, it is currently forming its base around the bottom line of the trend. We can assume a strong bounce back, after creating the base. Let us see what the indicators are indicating:
The MACD and signal line is all set to enter into the negative zone. Moreover, with a bearish crossover on the chart. But, the overall market momentum is bearish. Hence, the price may decline further.
Currently, the RSI indicator is at 46.12%. It faced rejection at the 64.64% mark and fell to this level. Thus, selling pressures are slowly mounting. We have to wait and watch if selling pressures become strong enough to bring about a trend reversal.
The OBV indicator has broken its upward trajectory and has started sloping downwards. Thus, selling volumes are higher than buying volumes. High selling activity will exert downward pressure on the GRT price.
In short, when we look at all three oscillators, we can say that the price may continue to fall for a while. However, we cannot rule out the possibility of a trend reversal. We have to wait and watch to see if an intermittent price rise is a corrective action or the beginning of a positive trend.
Day-Ahead and Tomorrow
Currently, the price is below the second Fibonacci pivot point of $0.97. If the bears remain strong till day end, then the price is likely to fall below the first, second, and third support levels of $0.80, $0.74, and $0.61, respectively.
In the past week, the price has tested and fallen below the 38.2% FIB retracement level of $0.97. It may again test the resistance level of $0.91. Thereafter, we have to wait and watch if the price retests and breaks out of these levels. In that case, the price upswing is likely to continue tomorrow as well.