Minimal "succinct blockchain" built to curtail computational requirements, so DApps run faster. Miner has been described as the world's lightest blockchain due to the fact that its size remains constant despite usage growth. In addition, it maintains a balance between security and decentralization. In October 2020, the project was rebranded from Coda Protocol to Mina.
Mina Protocol, a lightweight platform for smart contracts, and Polygon, a popular scaling solution for Ethereum, have announced a bridge to combine their technologies.
The Mina Protocol claims to be the world's smallest blockchain, weighing in at a few kilobytes compared to Ethereum's 300-gigabyte blockchain. Because of this, syncing the Mina network is also much easier for everyone. Instead of hefty hardware requirements, you can run a full Mina node right from your smartphone. Let us look at the technical analysis of MINA.
Past Performance
MINA has touched its all-time high of $5.84 on 9th September 2021. In the last 24 hours, the price has increased by 10.37%. Also, the price has seen an appreciation of roughly 40.38% in the last seven days.
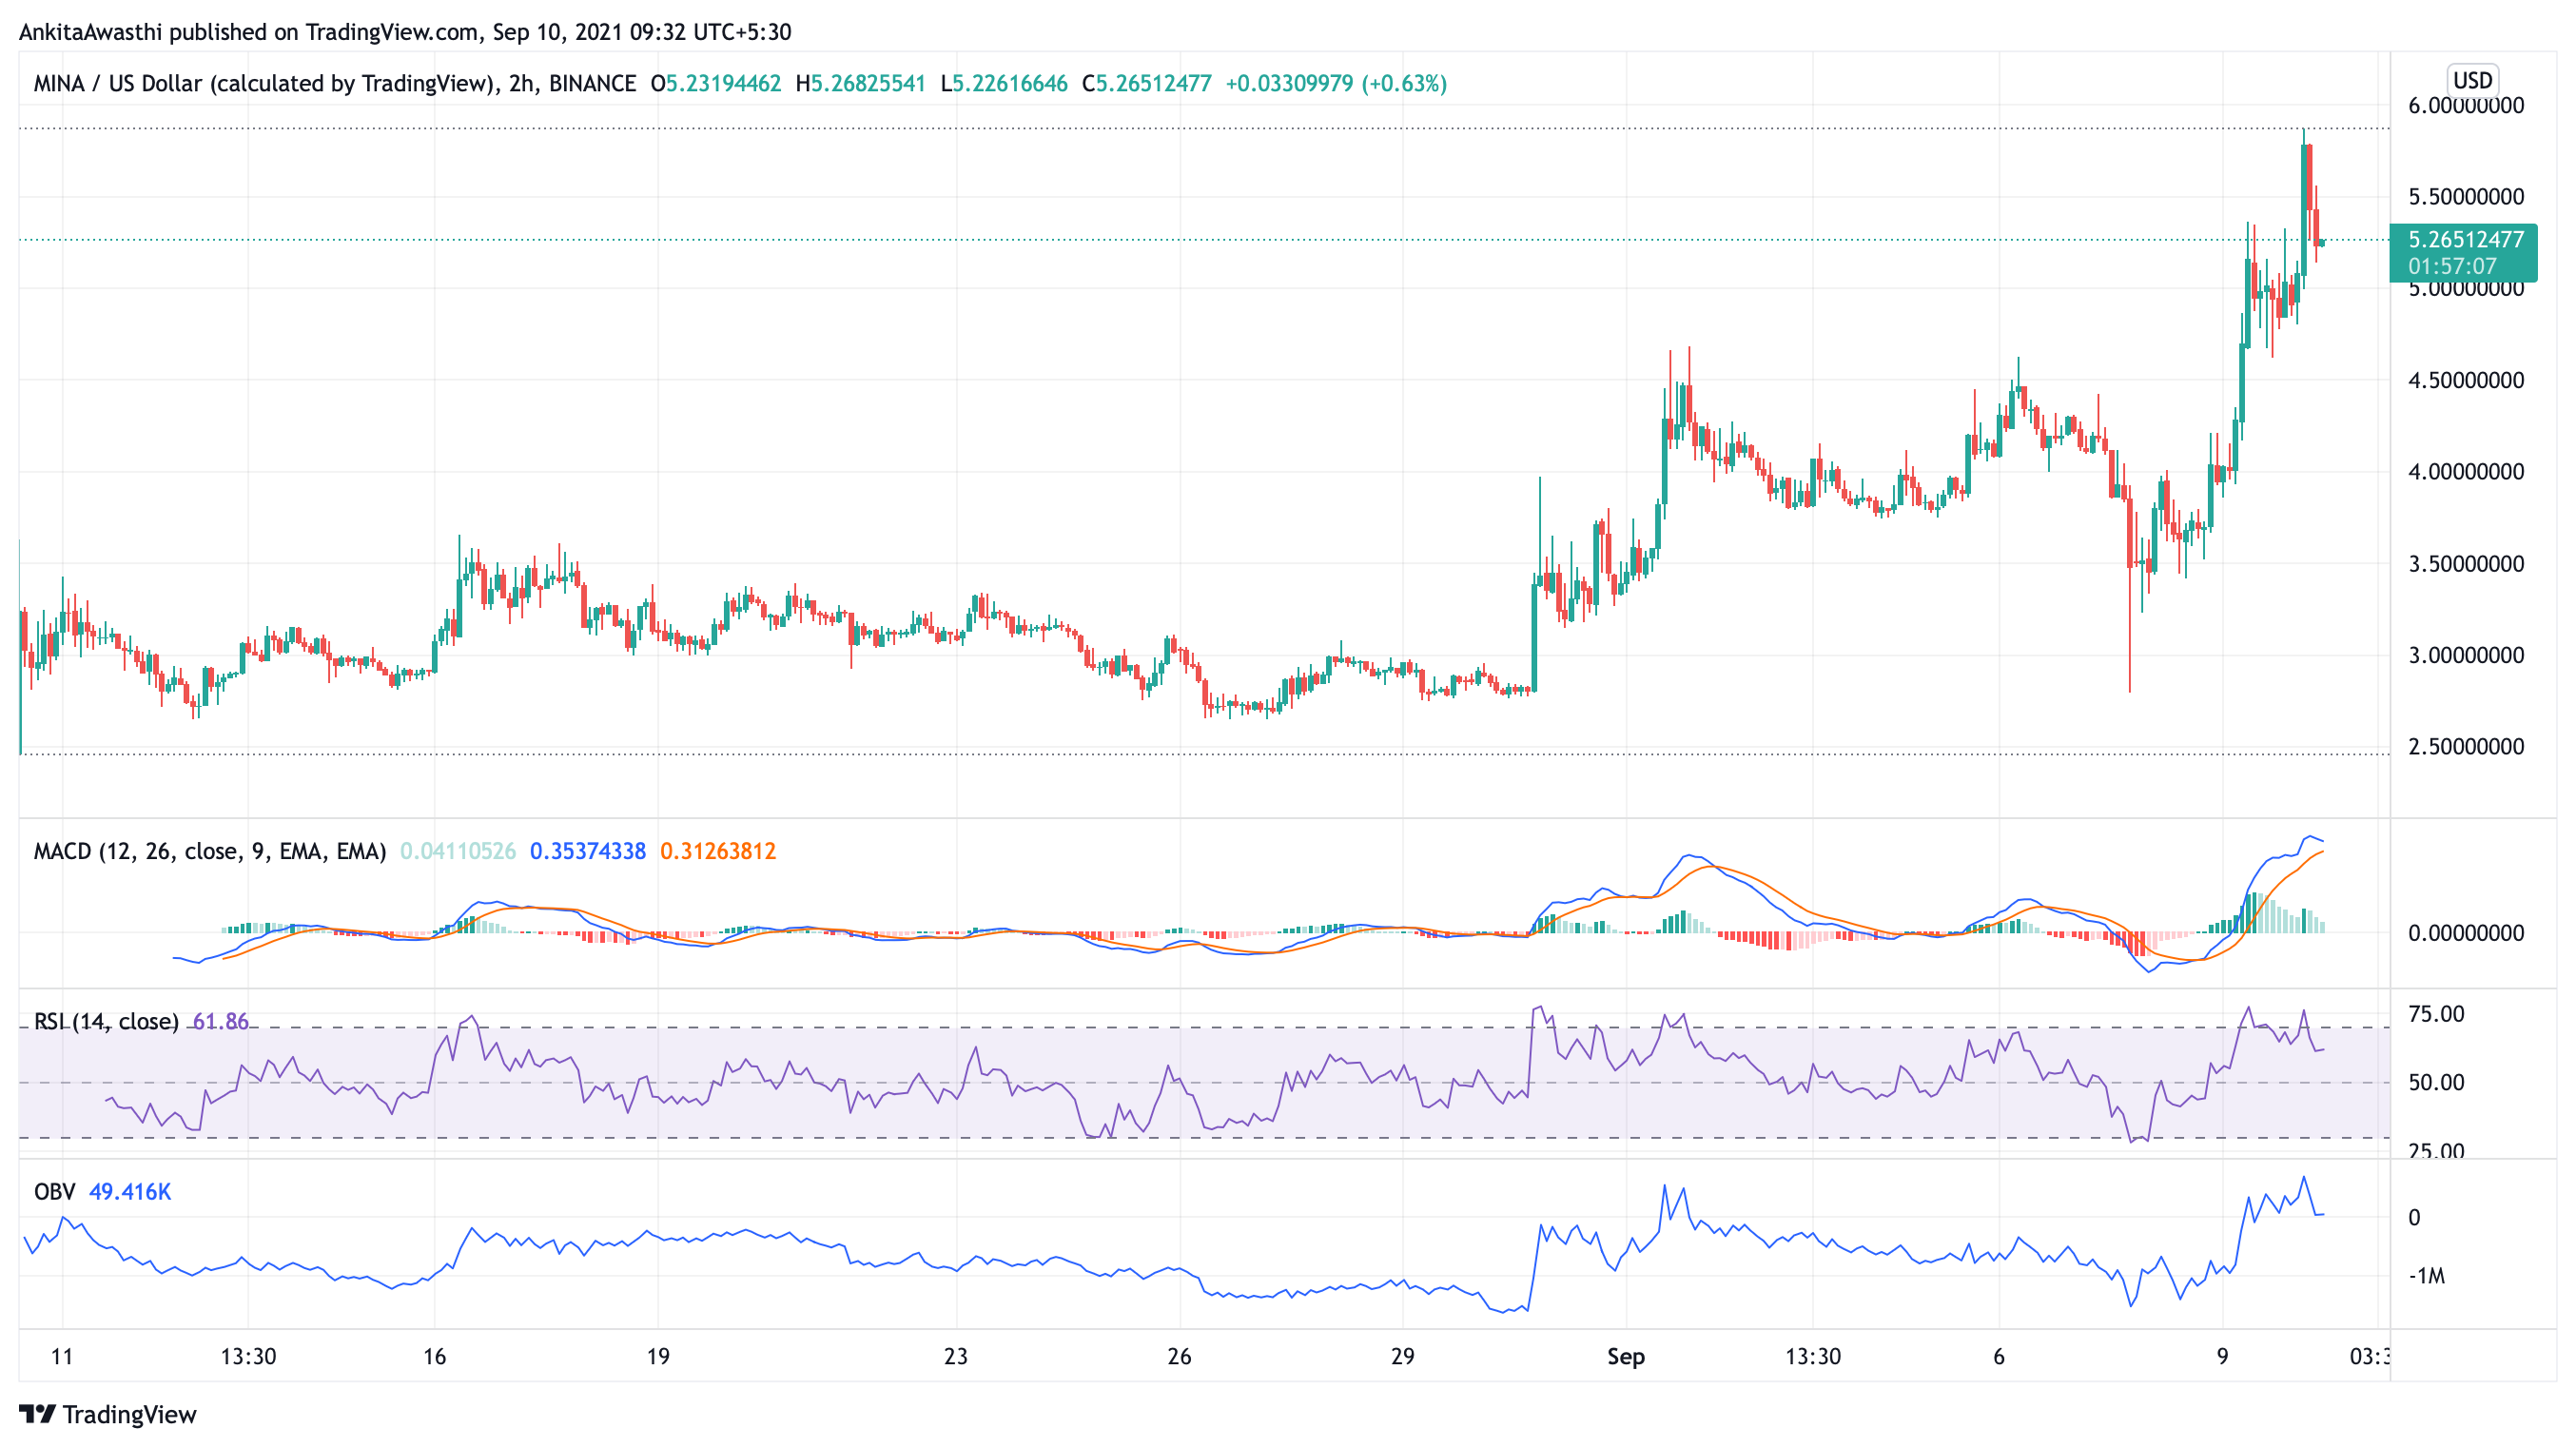
https://www.tradingview.com/x/uKUOAXga/
MINA Technical Analysis
MACD and EMA lines are above the zero range, suggesting a buy. Moreover, there is bullish crossover thereafter the MACD and EMA gained momentum and crossed the crucial zero range. MACD is rallying above the EMA suggesting the buying pressures are high on this horizon.
The RSI touched 76.12% and took a downswing, however, RSI took support at 61.60% and is making an uptrend on the chart. The RSI is making an uptrend on the chart, suggesting the buying pressures are overtaking the market.
On the daily chart, the OBV broke its downtrend and has gained momentum in volume that is shown by the slight uptrend of OBV on the chart.
Day-Ahead and Tomorrow
The MINA price has broken its recent high at $5.23. Thus, if the buying pressures gain momentum and the price increases further, the FIB retracement is formed at $5.29 and $5.31. Subsequently, traders can take a long position after a confirmatory breakout candle.
Moreover, if the price breaks down from this level, it will try to find immediate support at $5.28. Also, if the selling pressure persists, it will highlight the next support level at $4.70. An opportunity to short arises.