Bitcoin (BTC) has moved above the $51,200 resistance area.
Ethereum (ETH) and XRP (XRP) are in wave five of their bullish impulses.
Monero (XMR) is following an ascending support line.
Serum (SRM) has been rejected by the $9.90 resistance area.
Cardano (ADA) is decreasing toward the $2.45 horizontal support area.
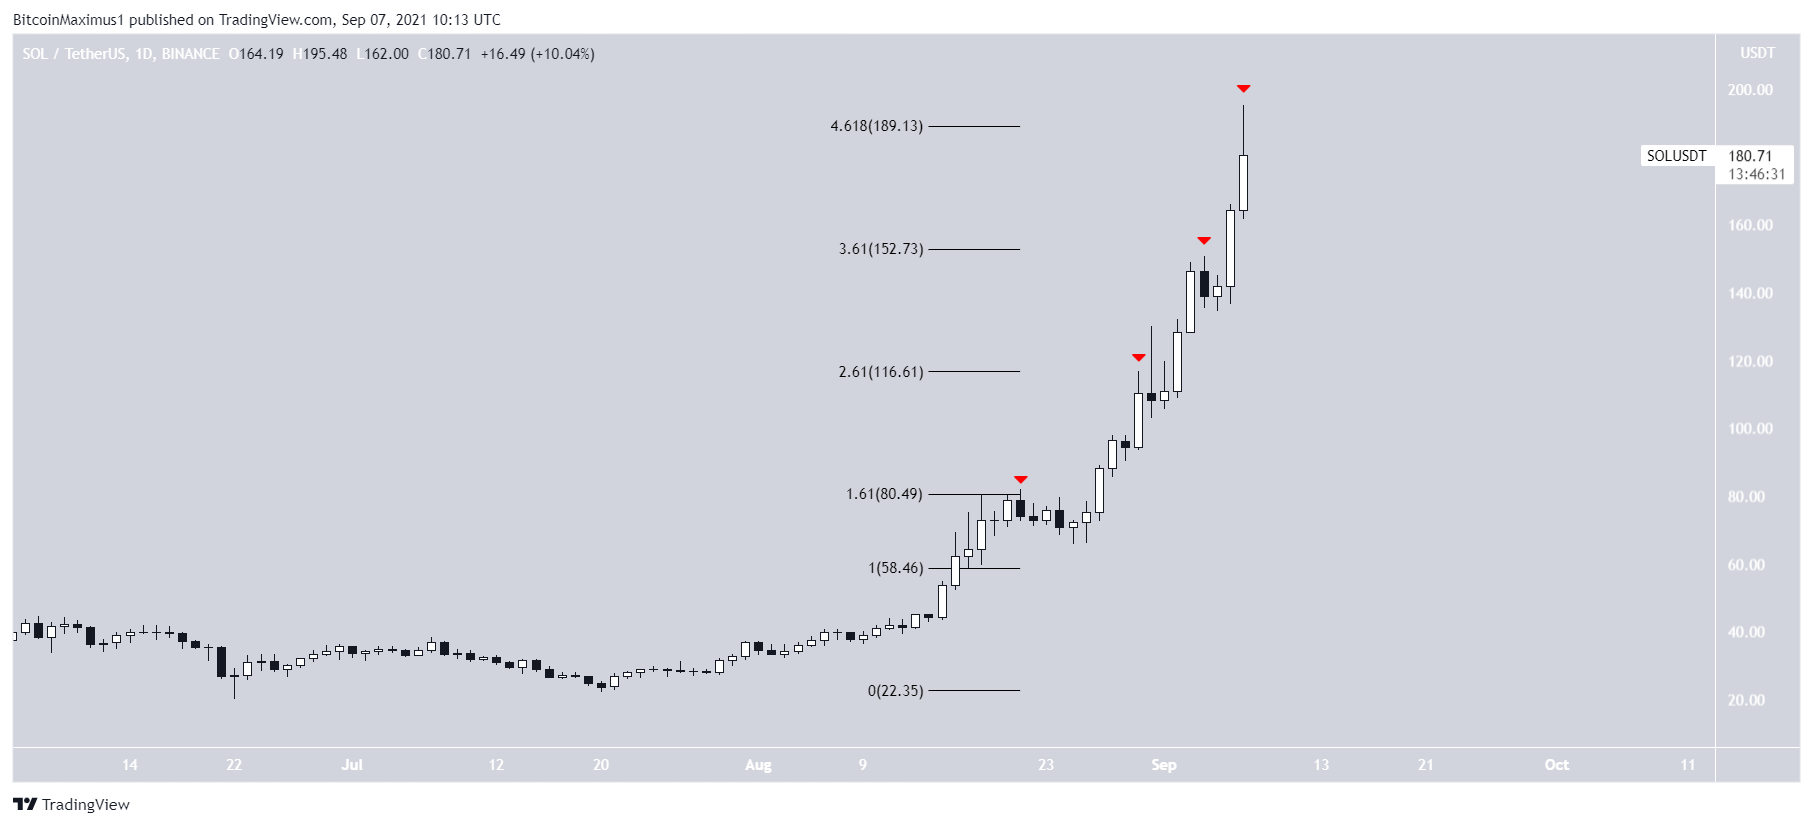
Solana (SOL) reached a new all-time high price on Sept 7.
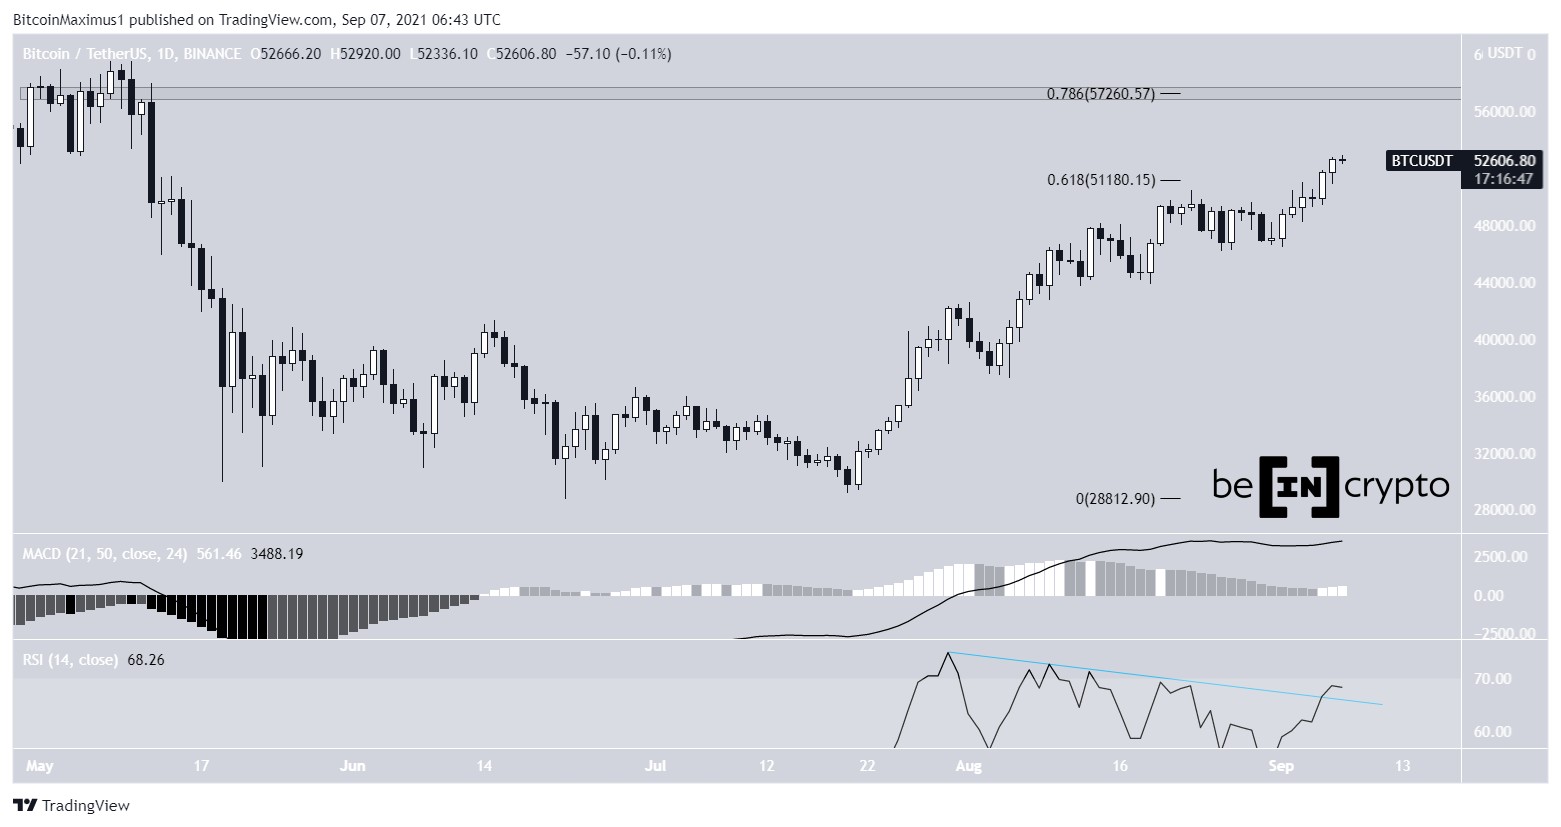
BTC
After being rejected by the 0.618 Fib retracement resistance level on Aug 23, BTC created a shooting star candlestick and dropped back.
On Sept 5, BTC finally managed to break out and reached a high of $52,920 two days later. Technical indicators are providing several bullish signs. The bearish divergence trendline in the RSI has been broken and the MACD has generated successive higher momentum bars.
The next closest resistance is found at $57,250. This target is the 0.786 Fib retracement resistance level and a horizontal resistance area.
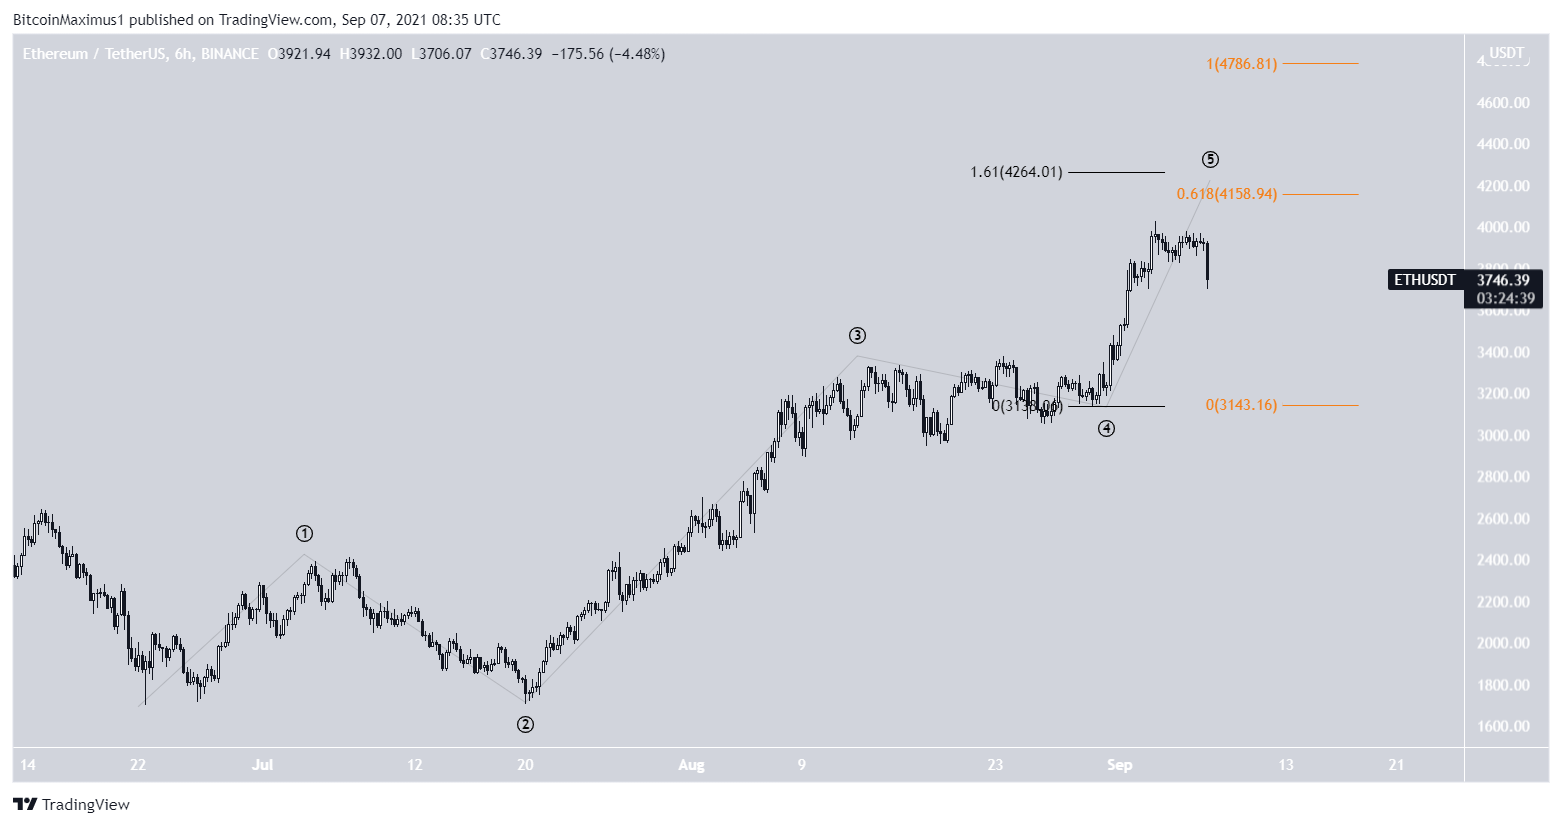
ETH
ETH has been moving upwards since June 22 and created a higher low on July 20.
After initially struggling to move above the $3,200 resistance area, ETH initiated another upward move and has so far reached a local high of $4,027.
The wave count indicates that ETH is in wave five of a bullish impulse.
The most likely target for the top of the upward movement is between $4,160 and $4,264. This range is made up of the 1.61 external Fib retracement resistance level (black) and the 0.618 length of waves 1-3 (orange).
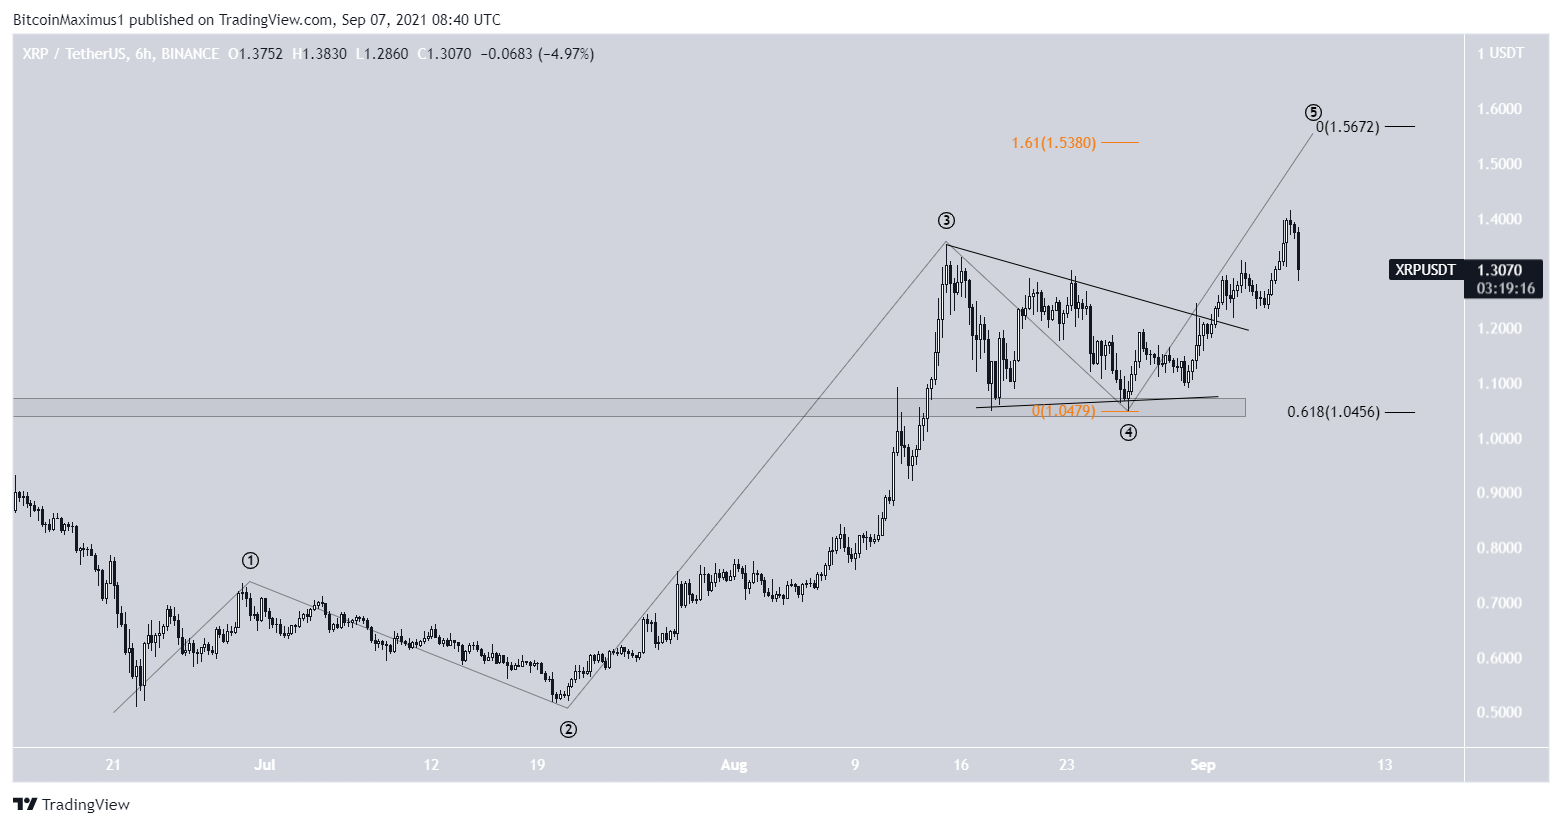
XRP
Similar to ETH, XRP has been increasing since June 22 and created a higher low on July 20.
After breaking out from the $1.05 resistance area, the price returned and validated the level as support on Aug 16.
After this, XRP broke out from a symmetrical triangle on Sept 1.
The wave count suggests that XRP is in wave five of a bullish impulse. The most likely target for the top of the upward move is between $1.53 and $1.57. This range is found using the 1.61 external Fib retracement of wave four and the 0.618 length of waves 1-3.
XMR
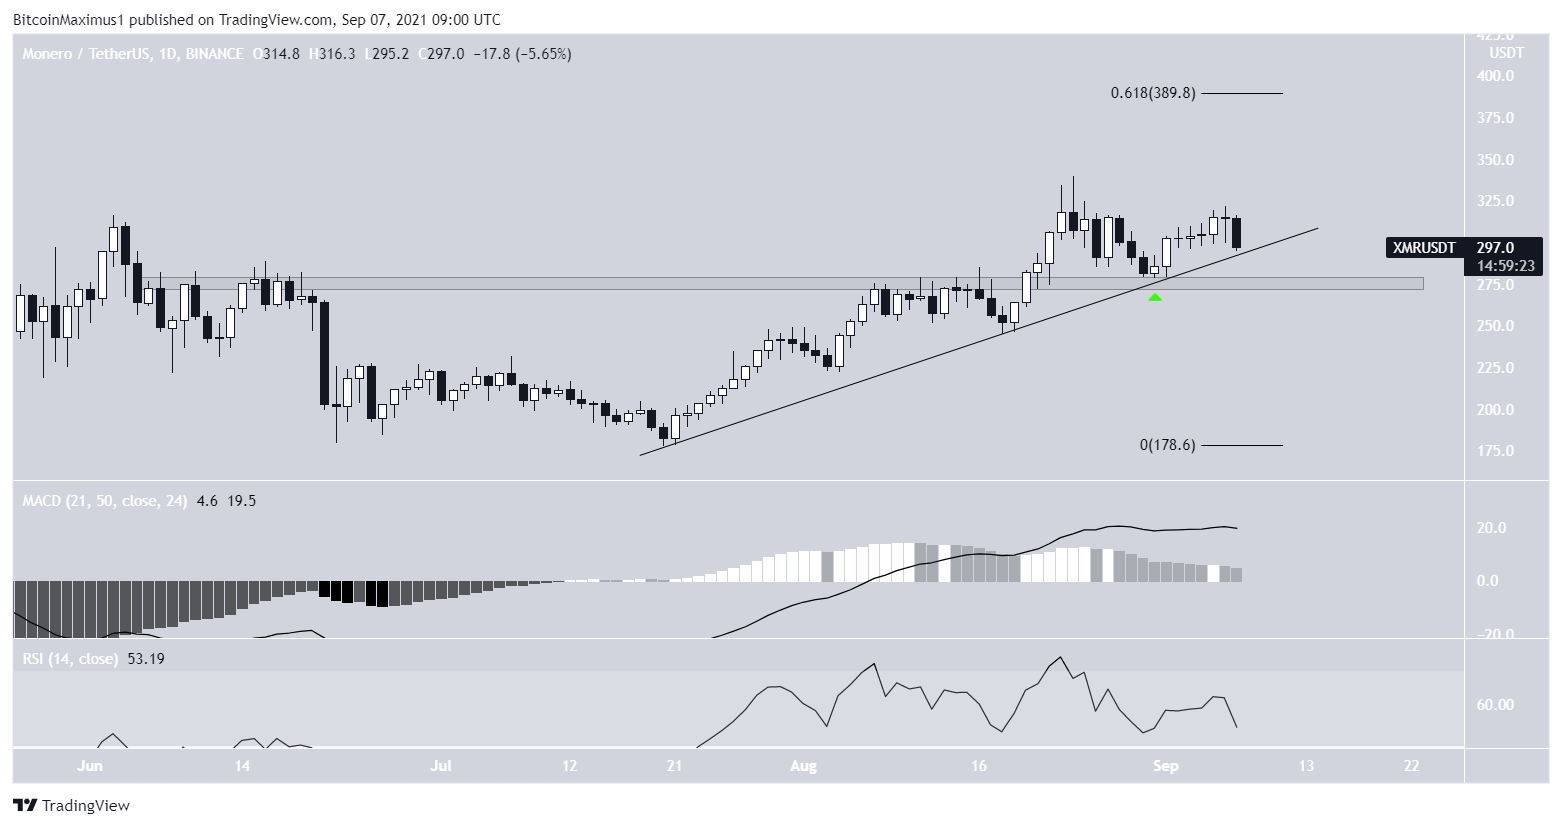
XMR has been following an ascending support line since July 20. On Aug 20, it managed to break out above the $277 horizontal resistance area and returned to validate it as support on Aug 31.
As long as the ascending support line remains intact, the bullish formation is still valid. While both the RSI and MACD are showing signs of weakness, the former is still above 50 and the latter is positive.
The closest resistance area is found at $390.
SRM
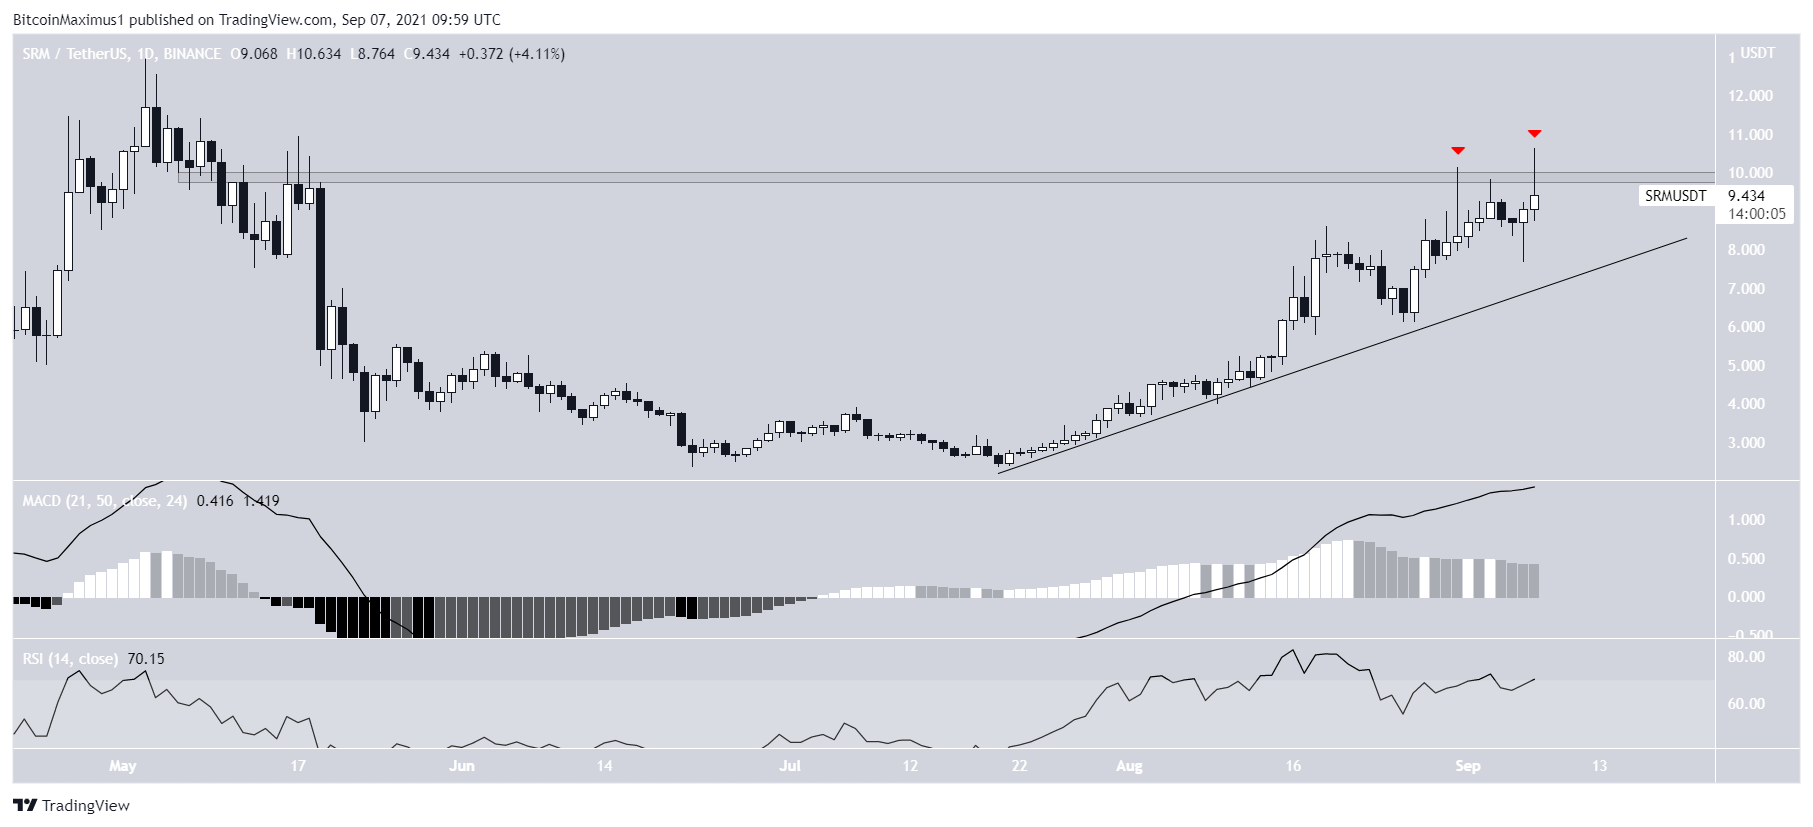
SRM has been increasing alongside an ascending support line since July 20. On Aug 31, it made an attempt at moving above the $9.90 resistance area but was rejected by it instead, creating a long upper wick (red icon).
Currently, it’s in the process of making another breakout attempt but has created another long upper wick.
Whether it breaks out above this resistance or gets rejected will go a long way in determining the direction of the future trend.
Due to the current rejection, it’s possible that SRM will retest the ascending support line once more before eventually moving upwards.
ADA
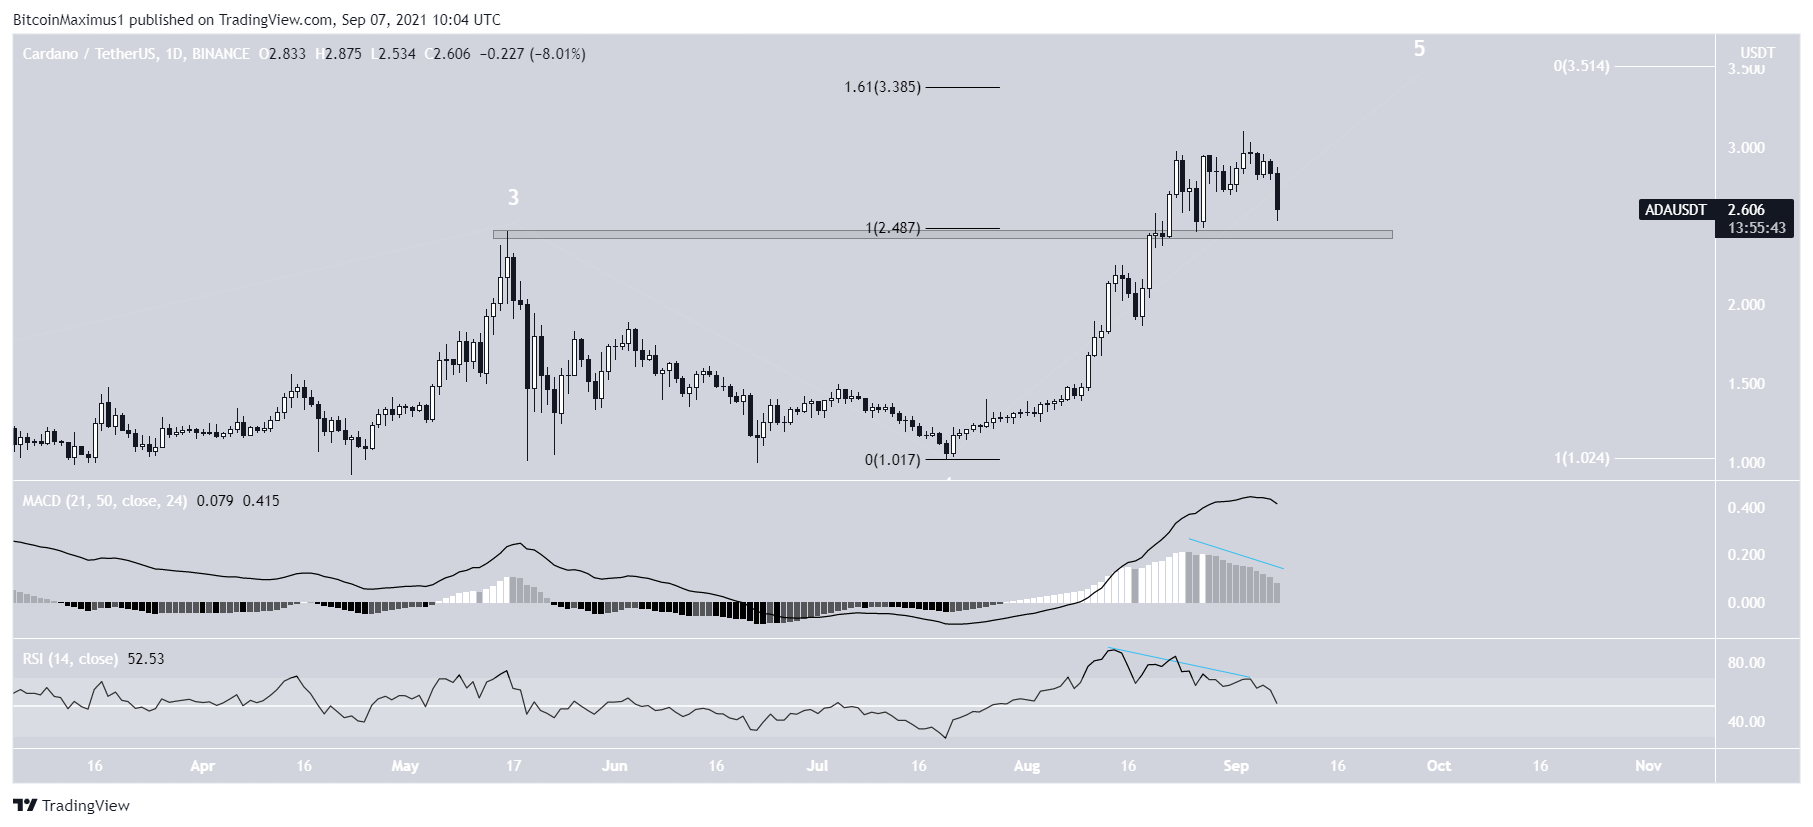
ADA has been moving upwards since July 20. On Aug 22, it broke out from the $2.45 resistance area and proceeded to reach a new all-time high price of $3.10 on Sept 2.
However, it fell sharply after both the RSI and MACD generated bearish divergences. It’s currently approaching the $2.45 area once again.
ADA appears to be is in a long-term wave five, therefore it could reach a top soon if it has not already done so. If another upward move were to transpire, the most likely target for the top would be between $3.38-$3.51.
SOL
SOL has been increasing rapidly since July 20. On Sept 7, it reached a new all-time high of $195.48.
Since the upward movement began, SOL has been briefly rejected by multiple external Fib retracement levels (red icons). Today, it reached the 4.61 external Fib retracement level, which often acts as the top an upward move.