Privacy and anonymity are important features of Zcash (ZEC), a decentralized cryptocurrency. Nodes on the network can verify transactions without revealing any sensitive information about them using the zk-SNARK zero-knowledge proof technology.
As opposed to what many people believe, Bitcoin (BTC) and the majority of cryptocurrencies are not anonymous, but rather pseudonymous. They do not explicitly reveal users' identities, but each user has an address that can be traced back to them through data science and blockchain forensics. Let us look at the technical analysis of ZEC.
Past Performance
The current price is $148.91, which is down by 2.70% in the last 24 hours. The depreciation in the price brought the market cap of ZEC down by 2.56% in the last 24 hours. ZEC traded between $147.79-$154.77 in the last 24 hours.
https://www.tradingview.com/x/1SxGKdvj/
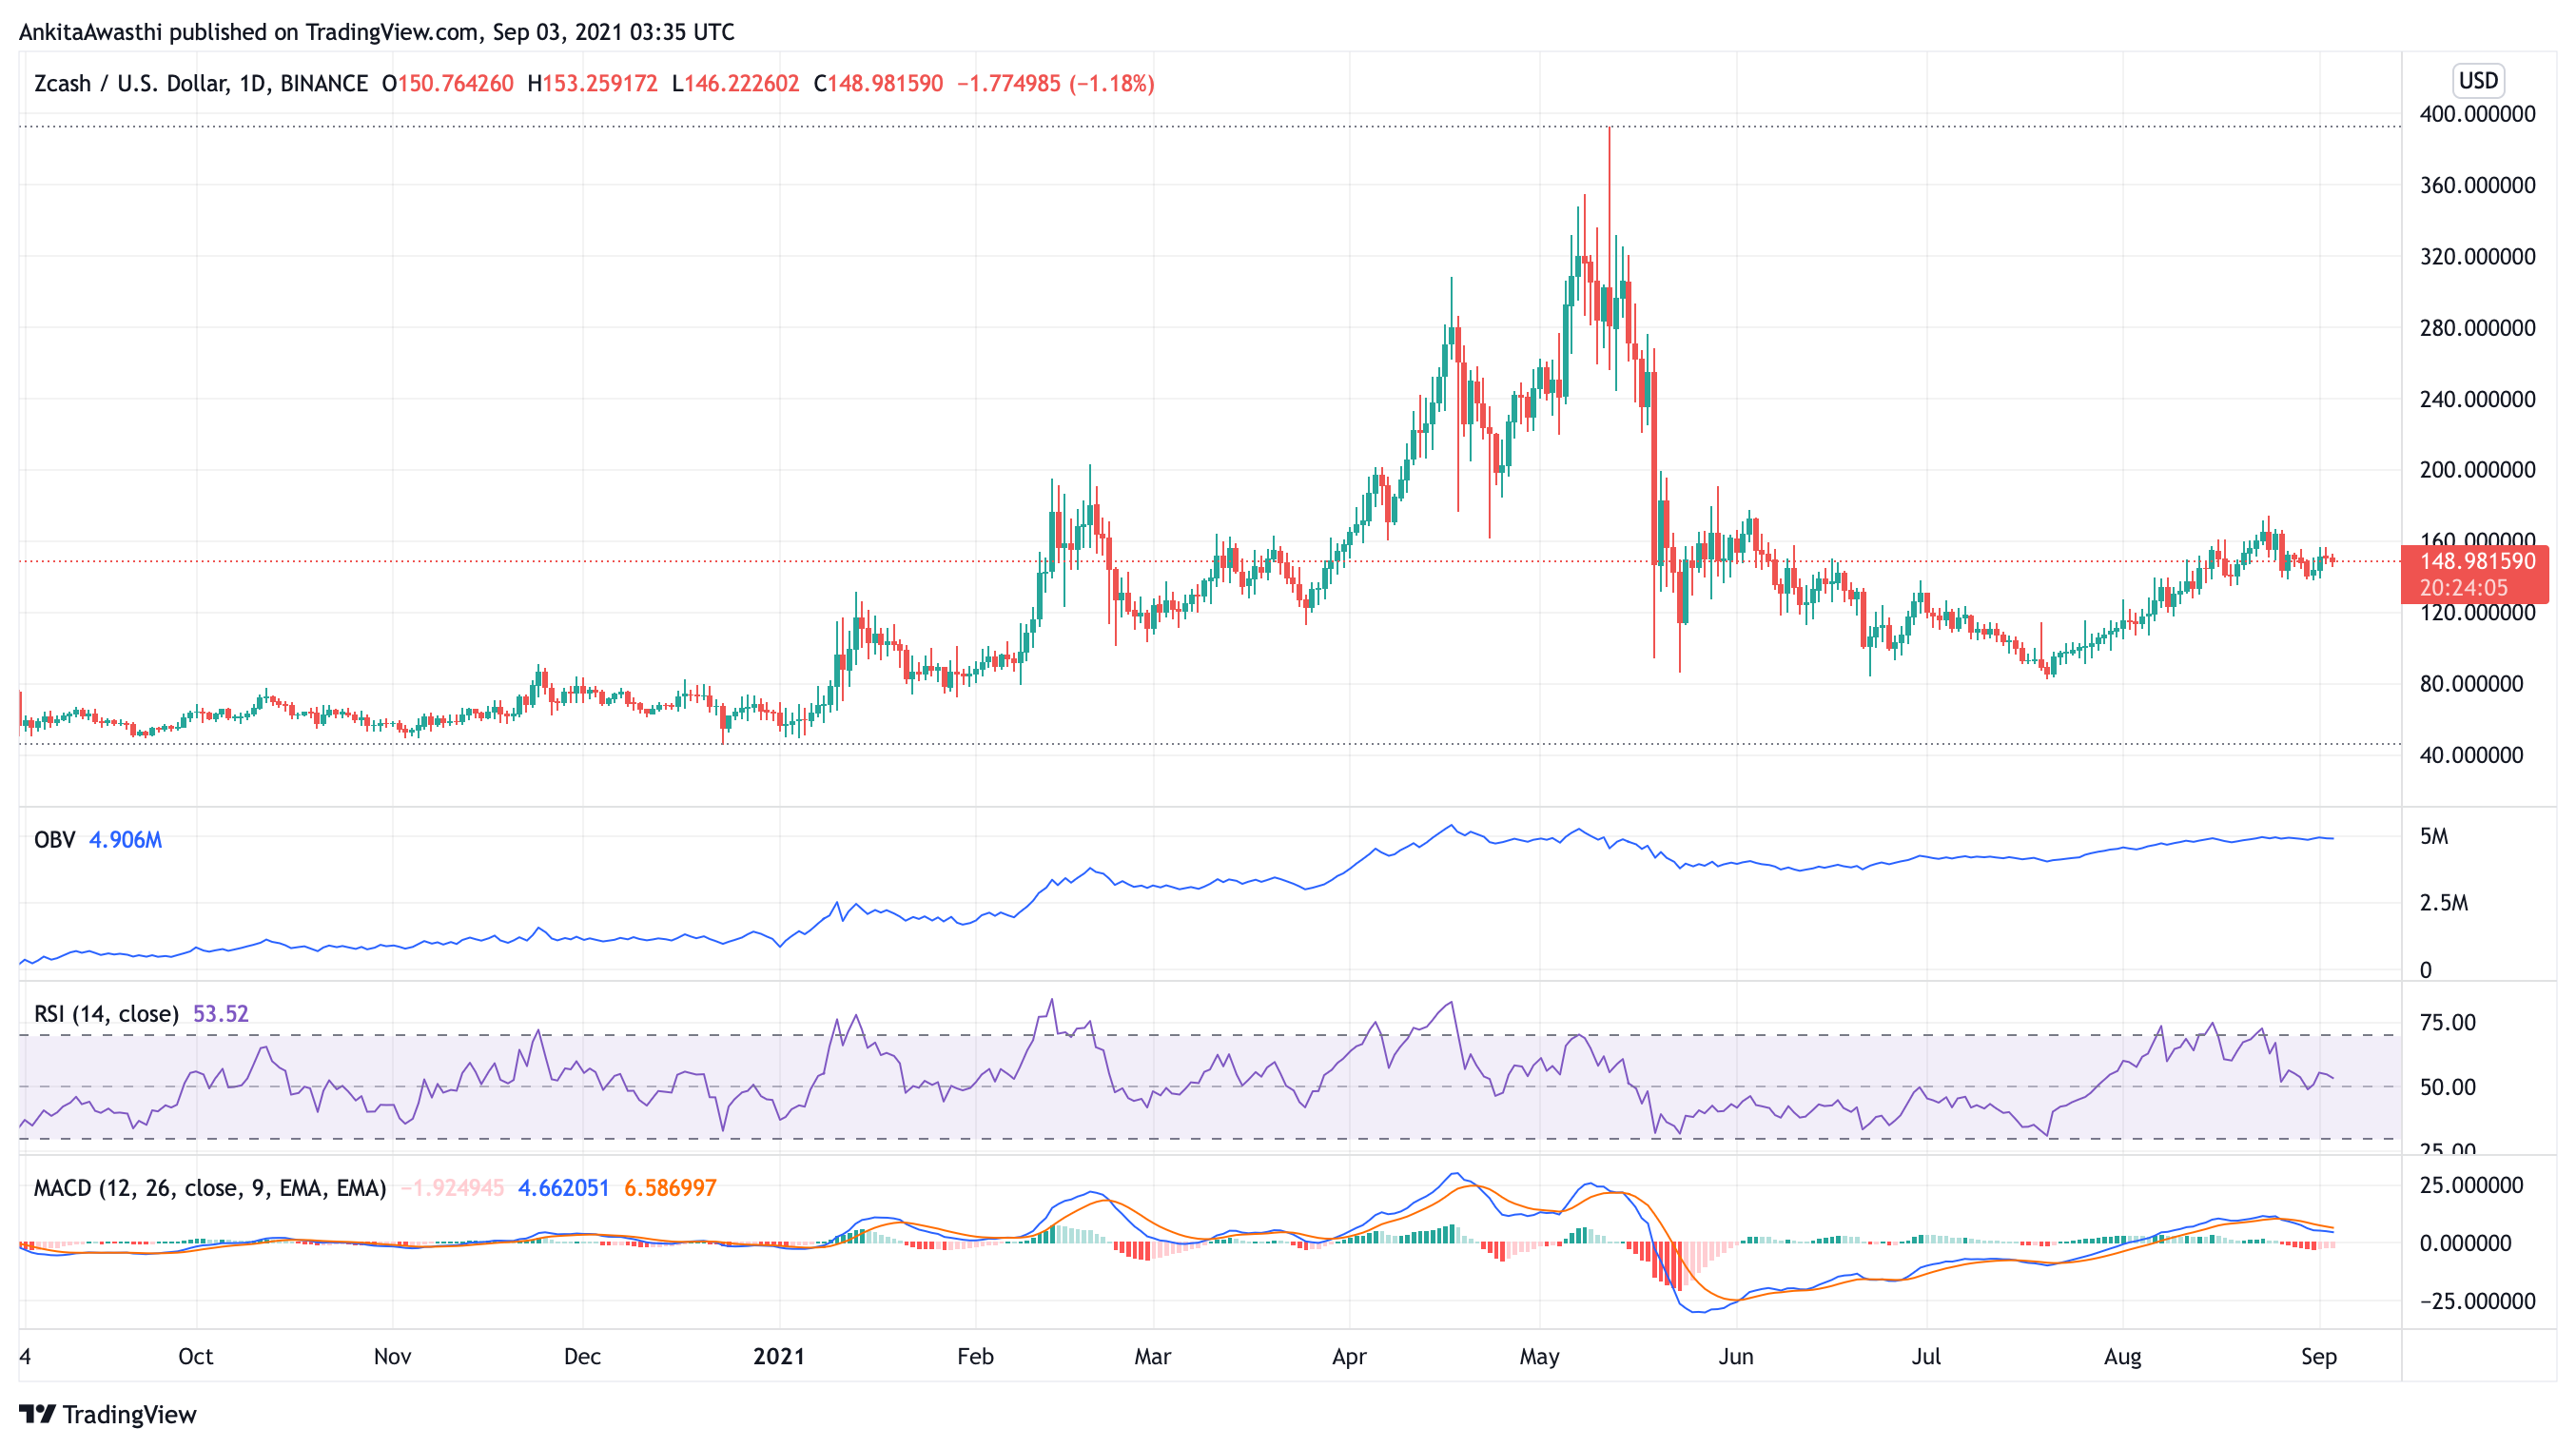
ZEC Technical Analysis
ZEC is trading in a parallel range. A breakout on either side of the range will predict the future trend of the token. After resisting from the top line of the channel, ZEC is currently making support near the $146 level. A positive trigger in the market will let ZEC break the resistance level at $155.
Currently, the RSI is on the mark 53.48%. RSI faced resistance at 55.46% and took a downswing suggesting that the selling pressures are higher than the buying pressures and there is a bearish trend in the market for ZEC.
MACD and EMA lines are above the zero range, however, there is a bearish crossover on the chart, the EMA line is rallying above the MACD line suggesting the selling pressures are greater than the buying pressures on this horizon.
On the daily chart, OBV broke an uptrend and is seen taking a downtrend suggesting the dip in the volume of ZEC.
Day-Ahead and Tomorrow
The ZEC price has successfully broken its recent FIB extension high at $137.96. On the chart, the price is falling. Thus, we might expect the price to find support near $122.36. At the current price, the traders might take a short position by keeping a stop loss at $154.
However, if the price increases, we might expect the price to test the immediate resistance level at $152.95. Traders can go long if the price breaks this resistance level. For a target of $171.