Past Performance
On August 13, 2021, XRP opened at $0.96. On August 19, 2021, XRP closed at $1.23. Thus, in the past week, the XRP price has increased by approximately 28%. In the last 24 hours, XRP has traded between $1.09-$1.26.
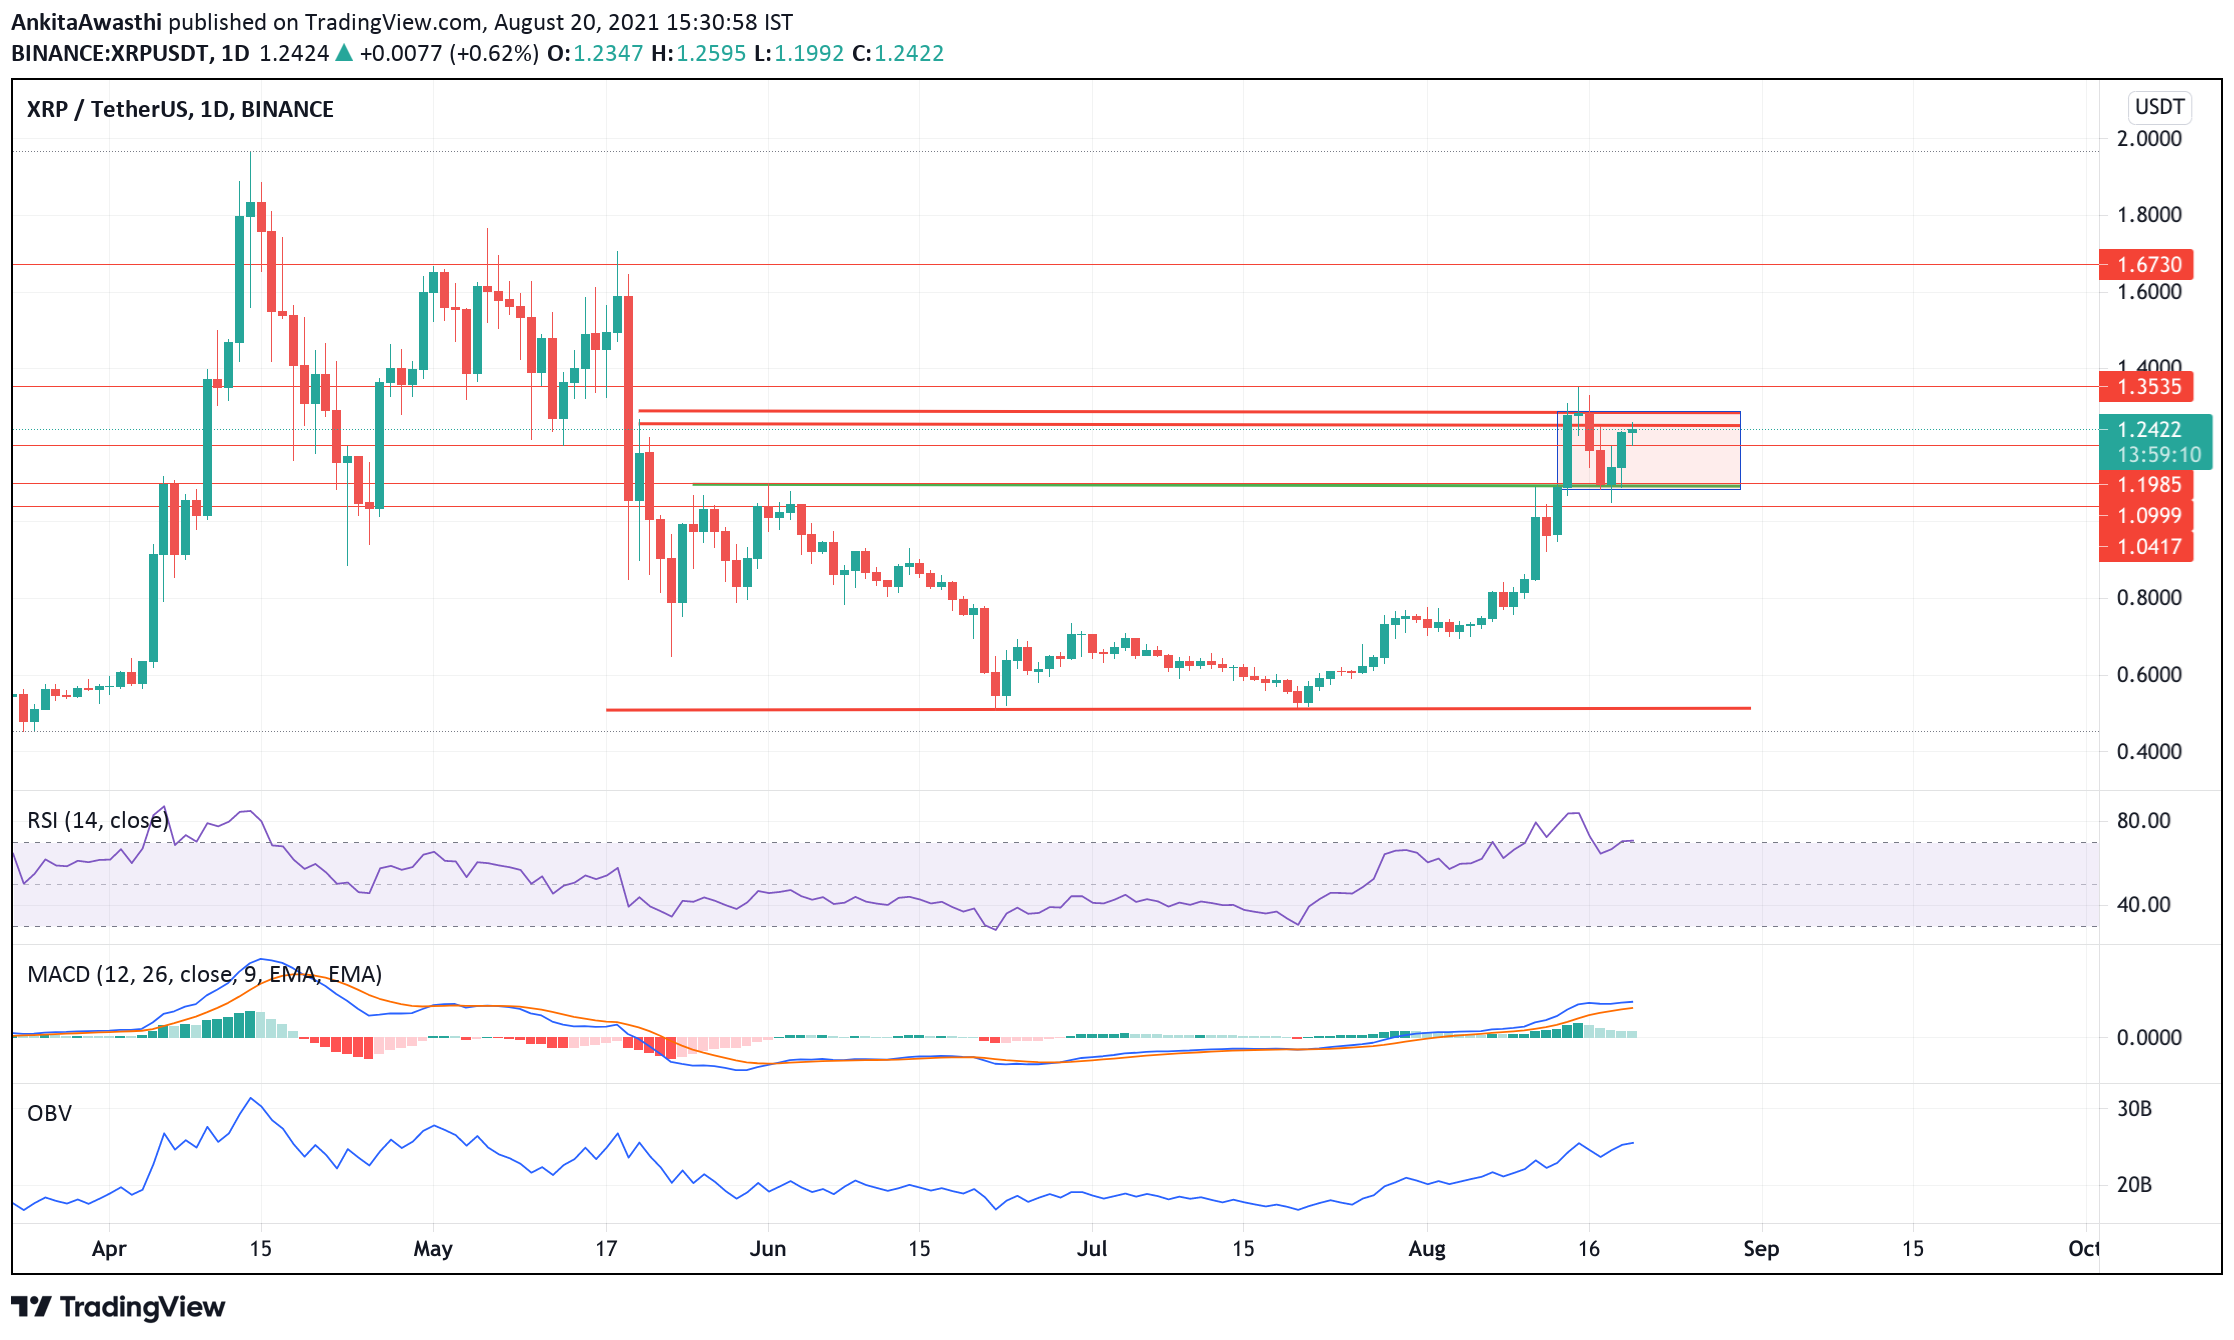
https://www.tradingview.com/x/MhycWElQ/
XRP Price Analysis
On assumption, that the SEC and XRP case will go in for the settlement, the buyer's interest was seen in the token. Moreover, a tweet from the CEO of ripple led to this pump in the price. However, the price is not able to breach May's resistance level, which is at $1.25.
At the time of press, the price is at $1.24, which is near its long-term resistance level at $1.25. Moreover, the token is currently forming its base between the range of $1.29 and $1.08. A break-out or a break-down from this range will decide the future of XRP. Till then, let us have a look at what the indicators are indicating;
The MACD and signal lines are in the positive range, thus, suggesting a buy signal. However, a bearish crossover by the MACD line over the Signal line has occurred. Thus, being the lagging indicator, we will have to wait and watch if the trend reversal is on the horizon or not.
Currently, the RSI indicator is at 71%. It faced rejection at the 84% mark and, currently, is taking constant support at the 69% mark. Thus, selling pressures are slowly mounting. We have to wait and watch if it becomes strong enough to bring about a bullish trend reversal. Until then, we can assume XRP will bounce back from this level.
On the daily chart, the OBV indicator has broken its long-term downtrend and picked an upward trajectory. Thus, buying volumes are higher than selling volumes.
Day-Ahead and Tomorrow
In short, when we look at all three oscillators, we can say that the price may continue to rise. However, we cannot rule out the possibility of a trend reversal. We have to wait and watch to see if an intermittent price rise is a corrective action or the beginning of a positive trend.
Currently, the price is below the second Fibonacci pivot point of $1.28. If the bears take over from this position, then the price is likely to fall below the first, second, and third support levels of $1.19, $1.09, and $1.04, respectively.
However, chances of it breaking out are higher. And, we can wait for another bull trigger and then expect the price to break out. Post which, the price will test immediate resistance at $1.35. If the price breaks this level on the upside, traders can take a long position, keeping the next target at $1.67.