Let us look at the technical analysis of KCS.
Past Performance
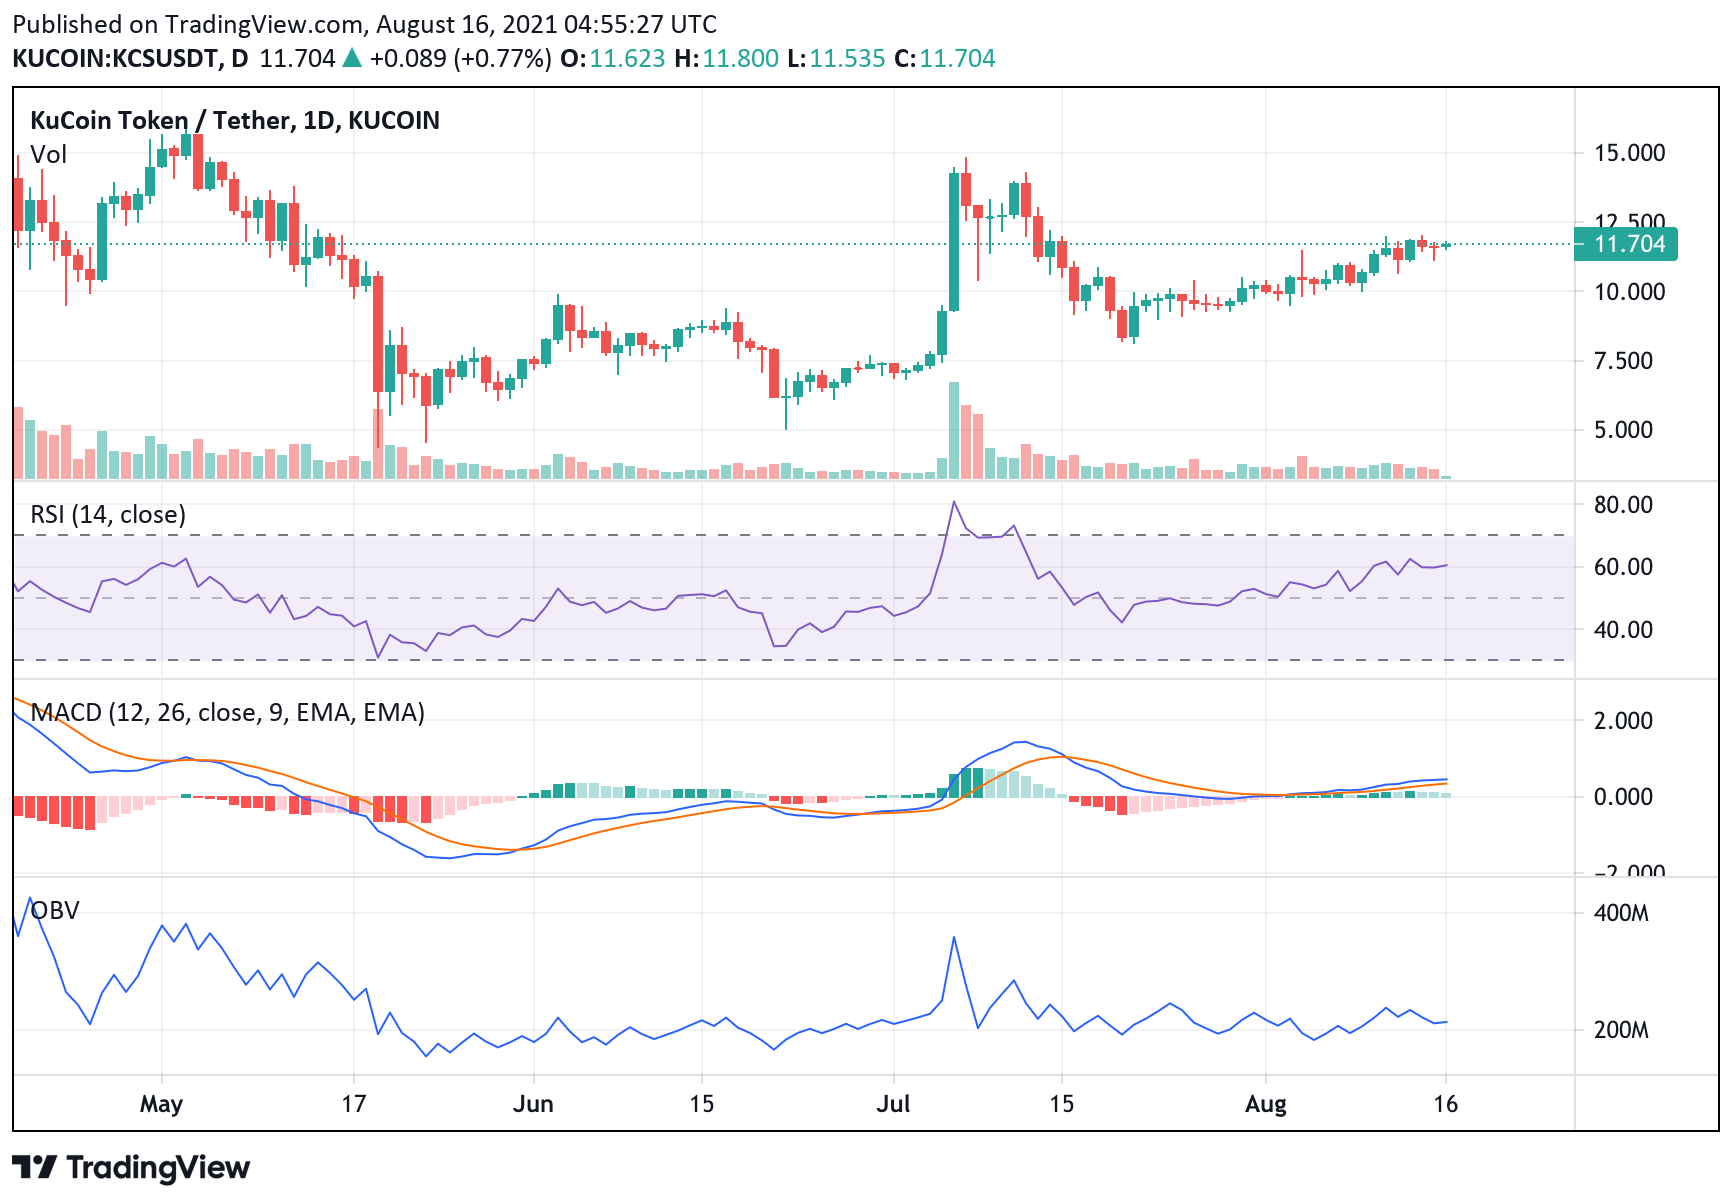
On Aug 09, 2021, KCS opened at $10.34. On Aug 15, 2021, AUG closed at $11.63. Thus, in the past week, the KCS price has increased by approximately 12.76%. In the last 24 hours, KCS has traded between $11.15-$11.57.
https://www.tradingview.com/x/JquiBWPr/
KCS Technical Analysis
Currently, KCS is trading at $11.07. The price has increased from the day’s opening price of $10.80. Thus, the market seems bullish.
Currently, the RSI indicator is at 60.44%. It faced rejection at 62% and fell to this level. Thus, selling pressures are slowly mounting. We have to wait and watch, to see if buying pressures become strong enough to bring about a bearish trend reversal.
The MACD and signal lines are entering the positive zone. Moreover, a bullish crossover by the signal line over the MACD line has occurred. Thus, the overall market momentum is turning bullish. Hence, the KCS price may increase further.
In short, when we look at both the oscillators, we can say that the price may continue to increase. However, we cannot rule out the possibility of a trend reversal. We have to wait and watch to see if an intermittent price rise is a corrective action or the beginning of a positive trend.
Day-Ahead and Tomorrow
If it breaks the immediate resistance level of $12.03, it will highlight the next resistance level of $13.31. Thus, traders can take a long position if the KCS price breaks out of this level.
Currently, the price is at the Fibonacci retracement level of $11.70. If the bears remain strong till day end, then the price is likely to fall below the first, second, and third support levels of $11.21, $10.25, and $9.12, respectively.