Bitcoin (BTC) has broken down from an ascending support line.
Ethereum (ETH) and Ravencoin (RVN) have broken out from ascending parallel channels.
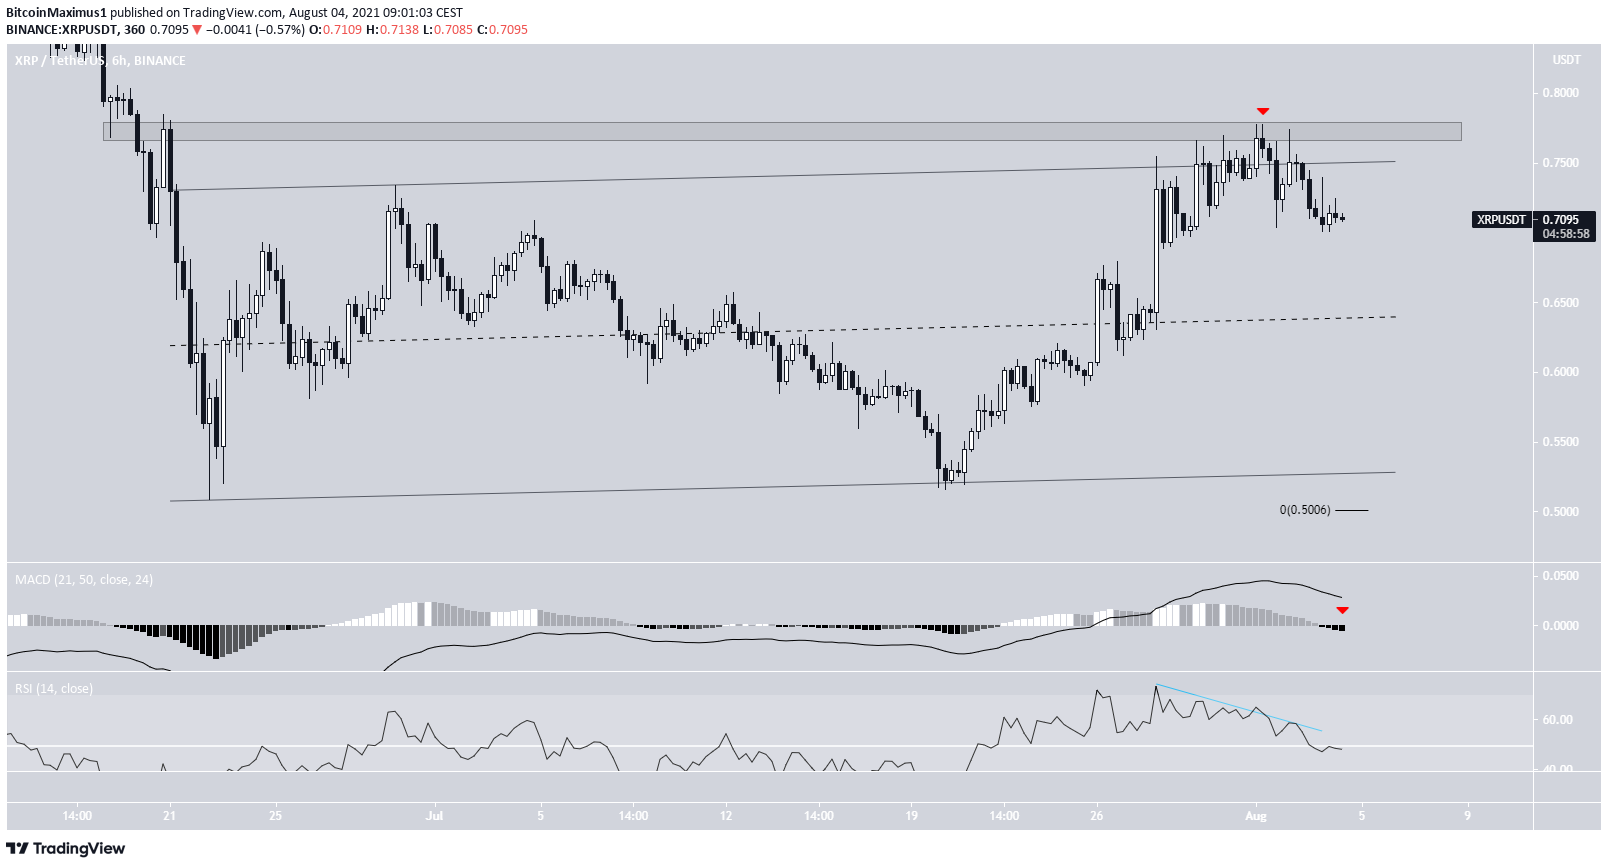
XRP (XRP) was rejected by the resistance line of an ascending parallel channel.
Monero (XMR) has broken out above a descending resistance line.
DigitalBits (XDB) reached a new all-time high on Aug 4.
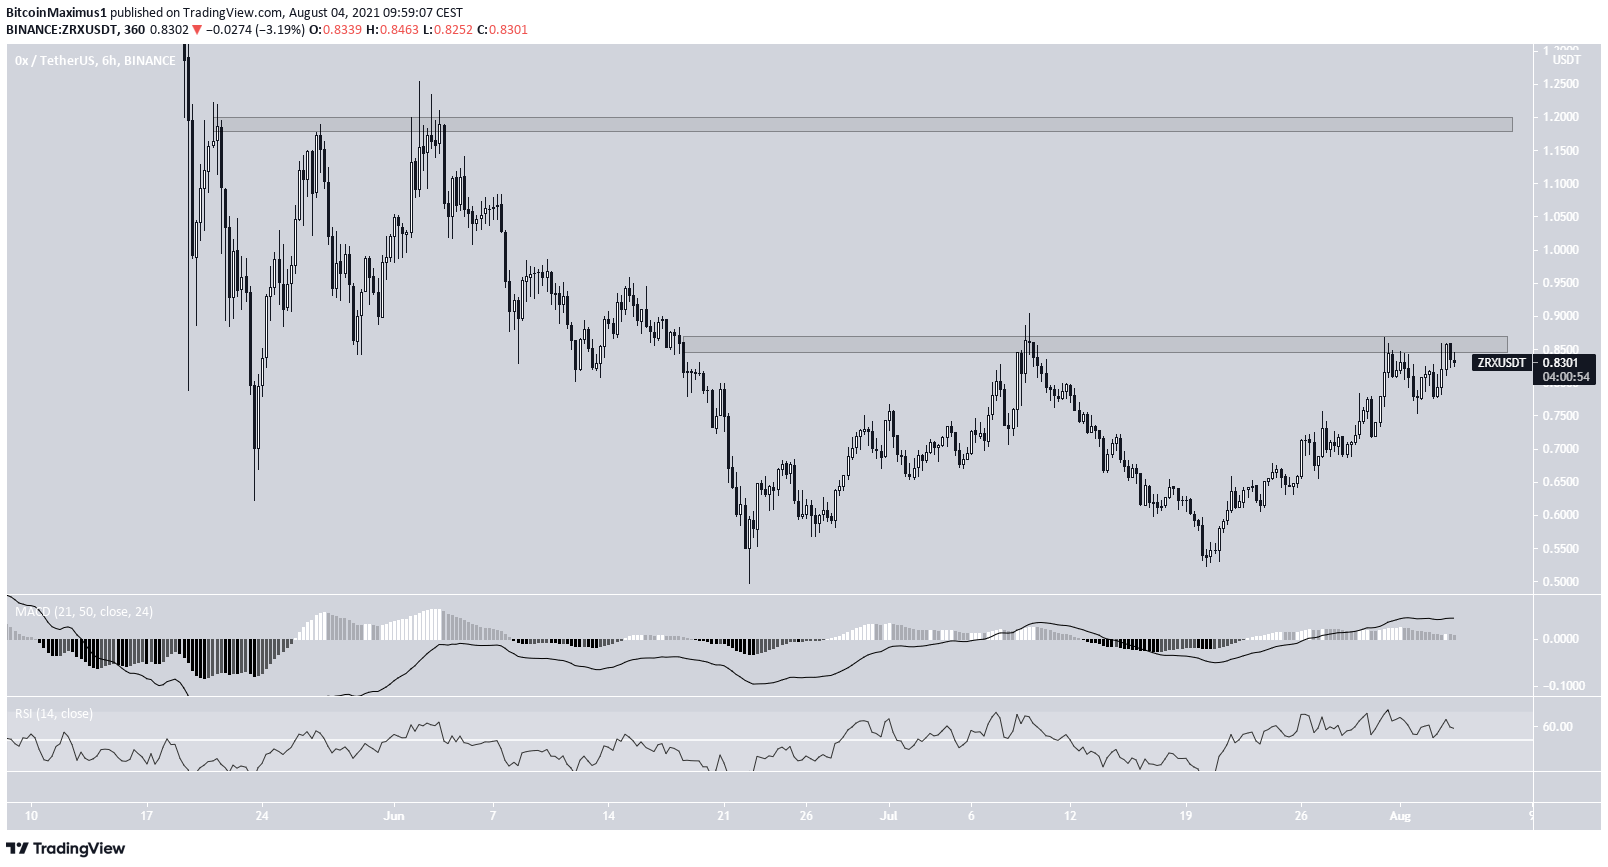
0x (ZRX) is attempting to break out from the $0.86 resistance area.
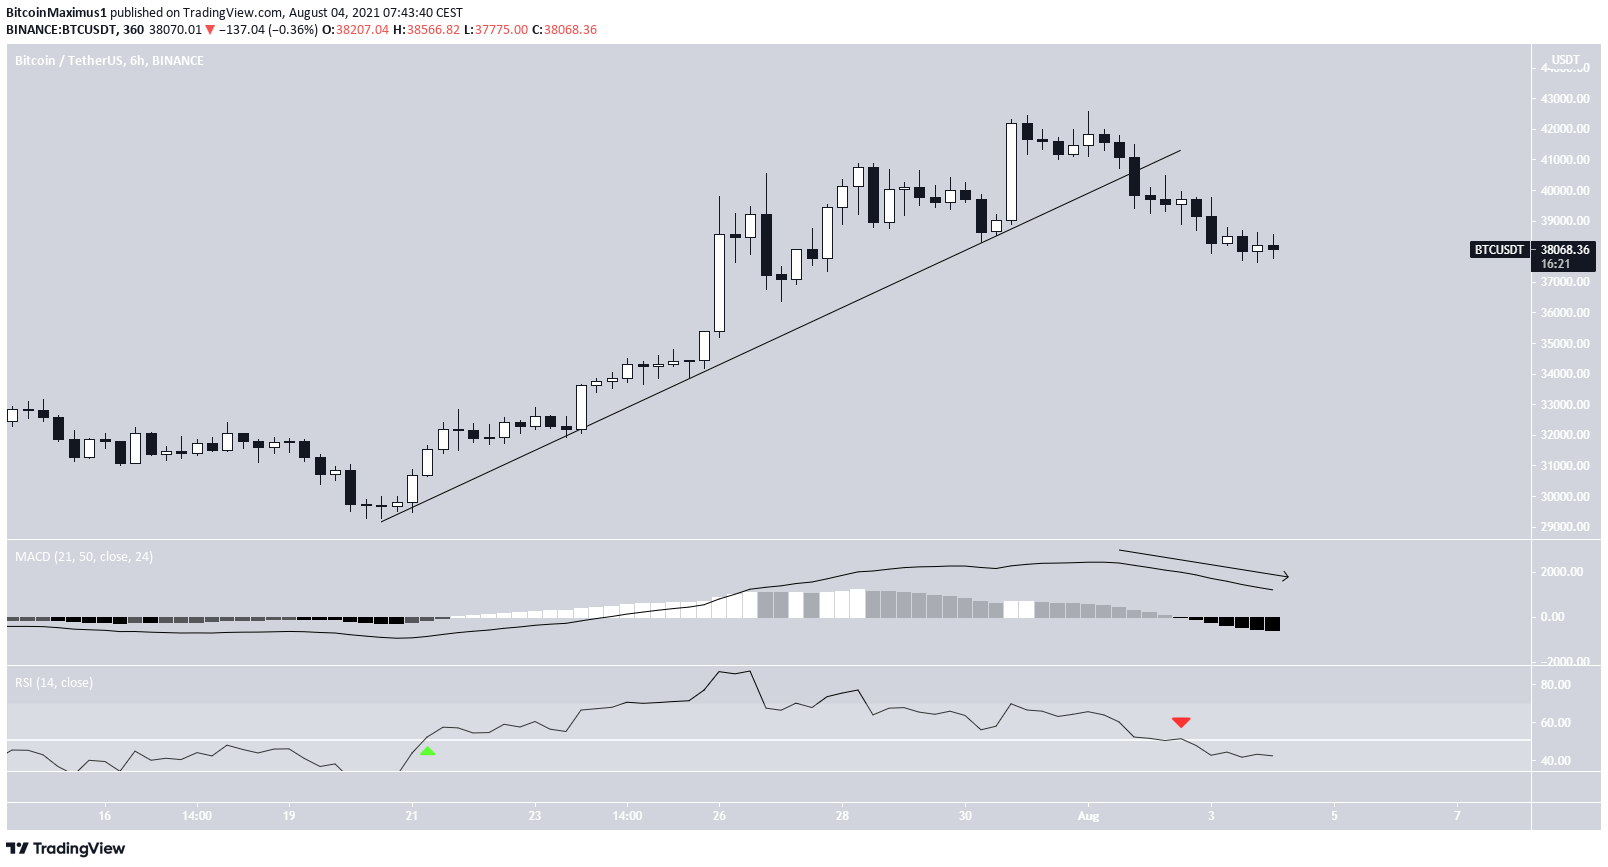
BTC
BTC had been increasing above an ascending support line since July 20. At the time, the RSI moved above the 50-line (green icon).
The upward move continued until a high of $42,599 was reached on Aug 2. Following this, a downward move caused a breakdown from the support line which caused the RSI to move below 50 (red icon).
However, BTC is trading at short-term support and could rebound.
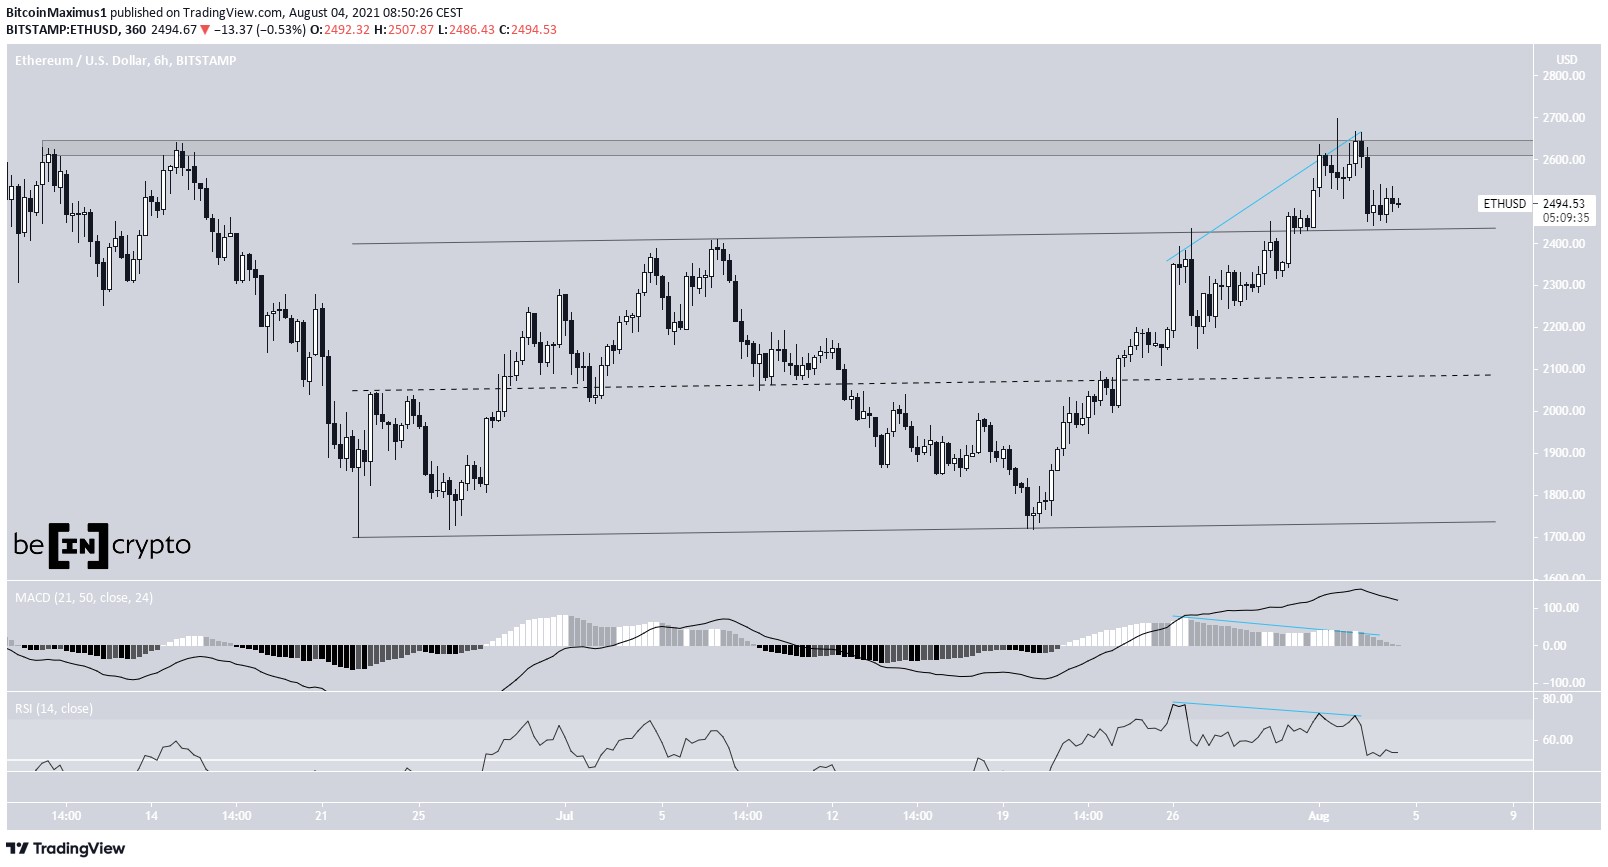
ETH
ETH had been trading inside an ascending parallel channel since June 22. After creating a higher low on July 20, it accelerated and broke out on July 31.
This led to a high of $2,699 on Aug 1. The high was made at the $2,630 resistance area and was combined with multiple bearish divergences, present in both the RSI and MACD.
ETH has been decreasing since and has just retested the resistance line of the channel, potentially validating it as support. Whether it manages to stay above this line or fall back inside the channel could determine the direction of the next trend.
The most likely wave count indicates that a top has already been reached.
XRP
XRP has been trading inside an ascending parallel channel since June 22. On July 30, it made an attempt at breaking out, but was thwarted by the resistance line of the channel and the $0.78 resistance level (red icon).
XRP has fallen back inside the channel since.
The closest support area is found at $0.65. This level is both a horizontal support and the midline of the channel.
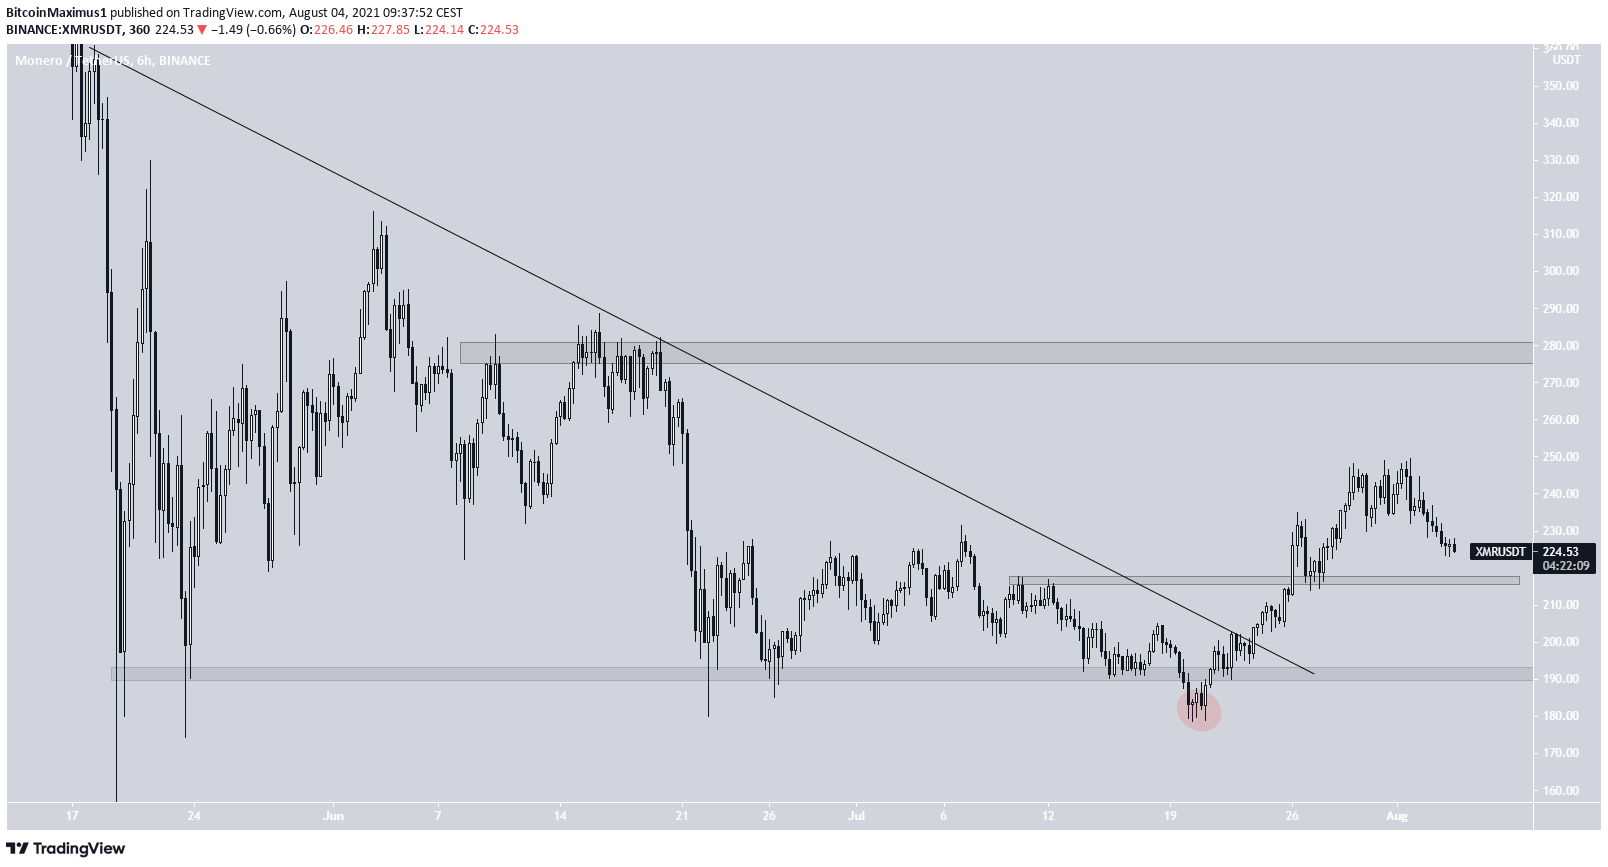
XMR
XMR has ben increasing since July 20, after deviating below the $192 horizontal area (red circle). On July 23, it managed to break out from a descending resistance line that had been in place since May 19.
XMR then proceeded to reach a high of $249 before falling. The closest support area is found at $216.50, while the closest resistance is located at $277.
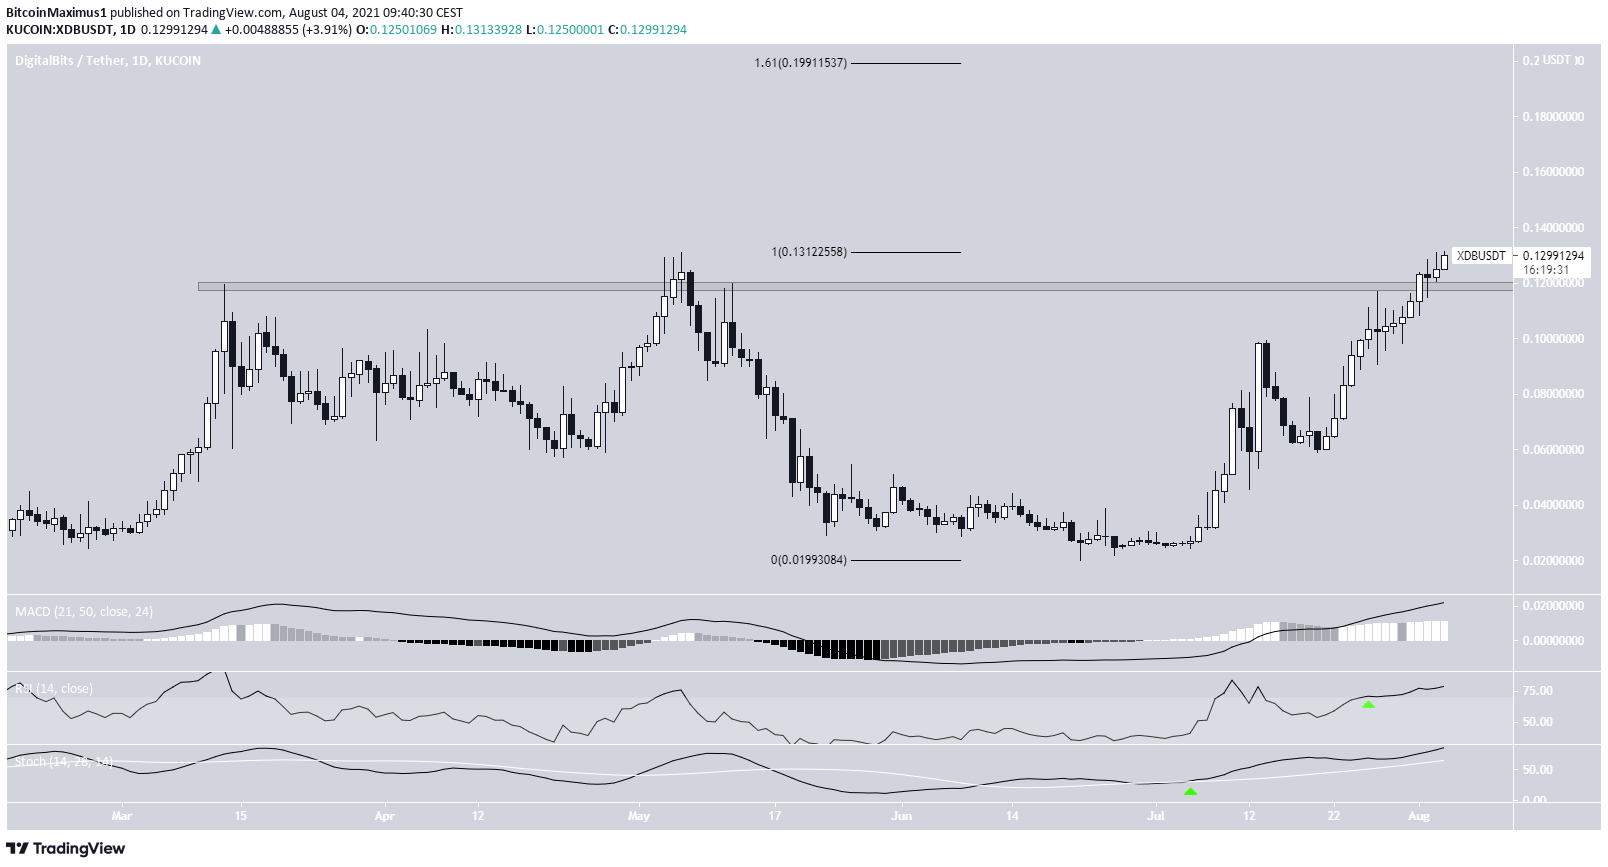
XDB
XDB has been moving upwards since June 22 and doing began to accelerate on July 20.
On Aug 1, it broke out above the $0.118 resistance area and proceeded to reach a new all-time high price on Aug 4.
Technical indicators in the daily time frame are bullish, supporting the continuation of the upward movement. This is especially evident by the RSI cross above 70 and the bullish cross in the Stochastic oscillator.
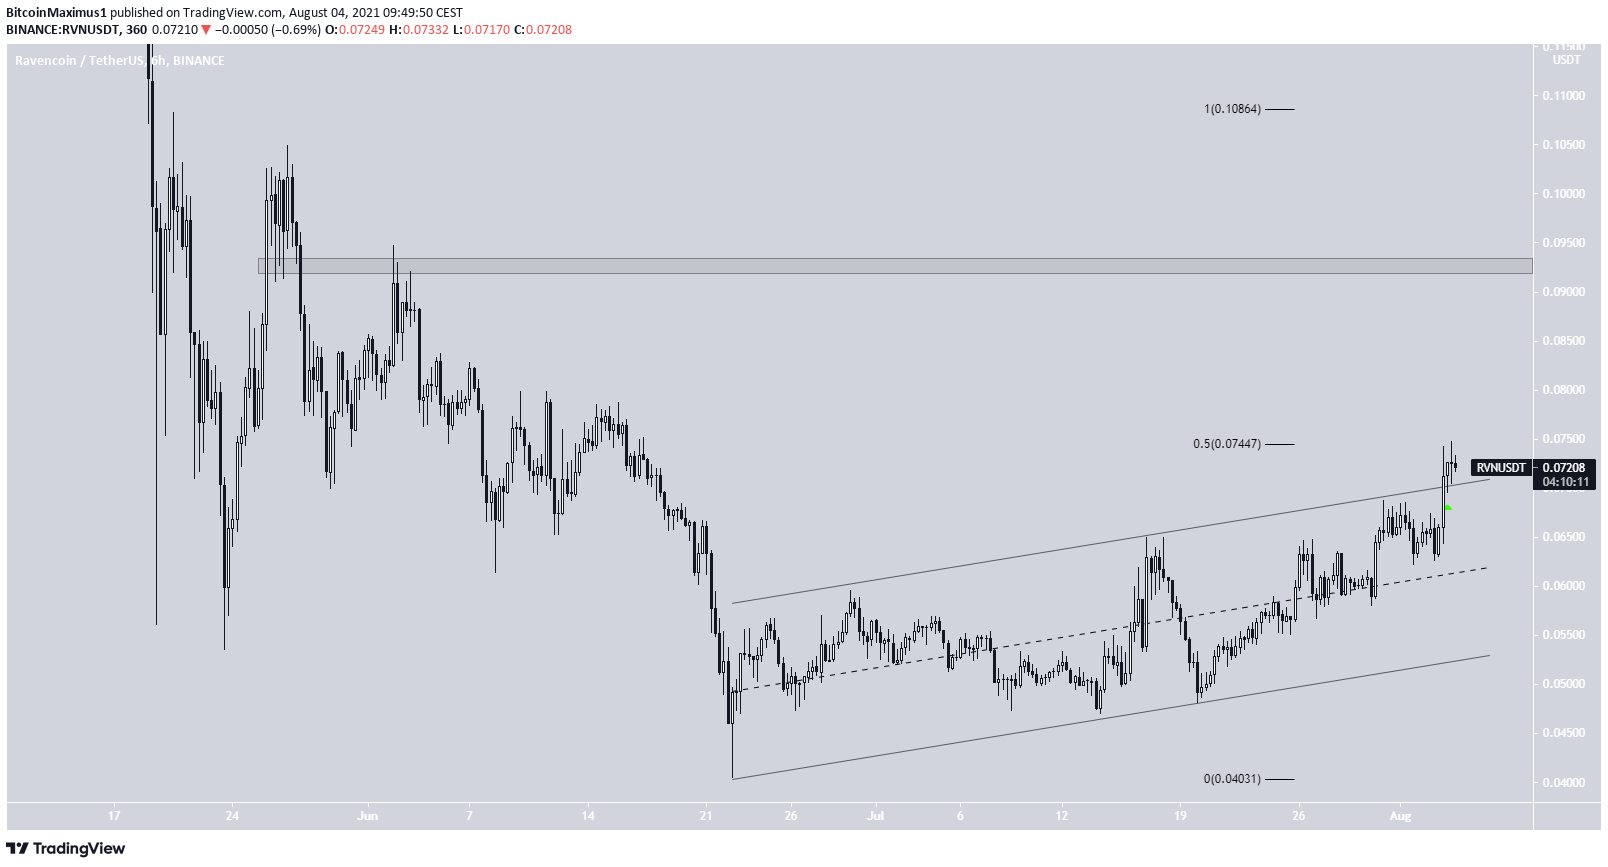
RVN
RVN has been increasing inside an ascending parallel channel since June 22. On Aug 3, it broke out from the channel and is currently in the process of validating it as support.
RVN is facing resistance from the 0.5 Fib retracement resistance level at $0.745. If it’s successful in moving above that resistance, the next target to reclaim would be $0.92.
ZRX
ZRX has been increasing since completing a double bottom pattern on July 20.
The upward move took it to the $0.86 resistance area on Aug 1, where it’s currently making its second breakout attempt.
However, technical indicators are relatively neutral, and aren’t showing any specific breakout signals. The next resistance area target is found at $1.20.