Flow is a safe, speedy, and user-friendly blockchain interface that facilitates the creation of new-age games, decentralized apps, and digital assets. It provides the basis for the development of internet-scale protocols and apps that require a high-quality user experience. FLOW is the native token of this ecosystem. Let us look at the technical analysis of FLOW.
Past Performance
On Jul 24, 2021, FLOW opened at $19.72. On Jul 30, 2021, FLOW closed at $23.70. Thus, in the past week, the FLOW price has increased by roughly 20%. In the last 24 hours, FLOW has traded between $17.97-$29.96. The price increase can be attributed to the announcement by Binance to list the token. The Dapper Labs token market capitalization is now at $1.23 billion.
https://s3.tradingview.com/snapshots/n/nt2TGUSV.png
Day-Ahead and Tomorrow
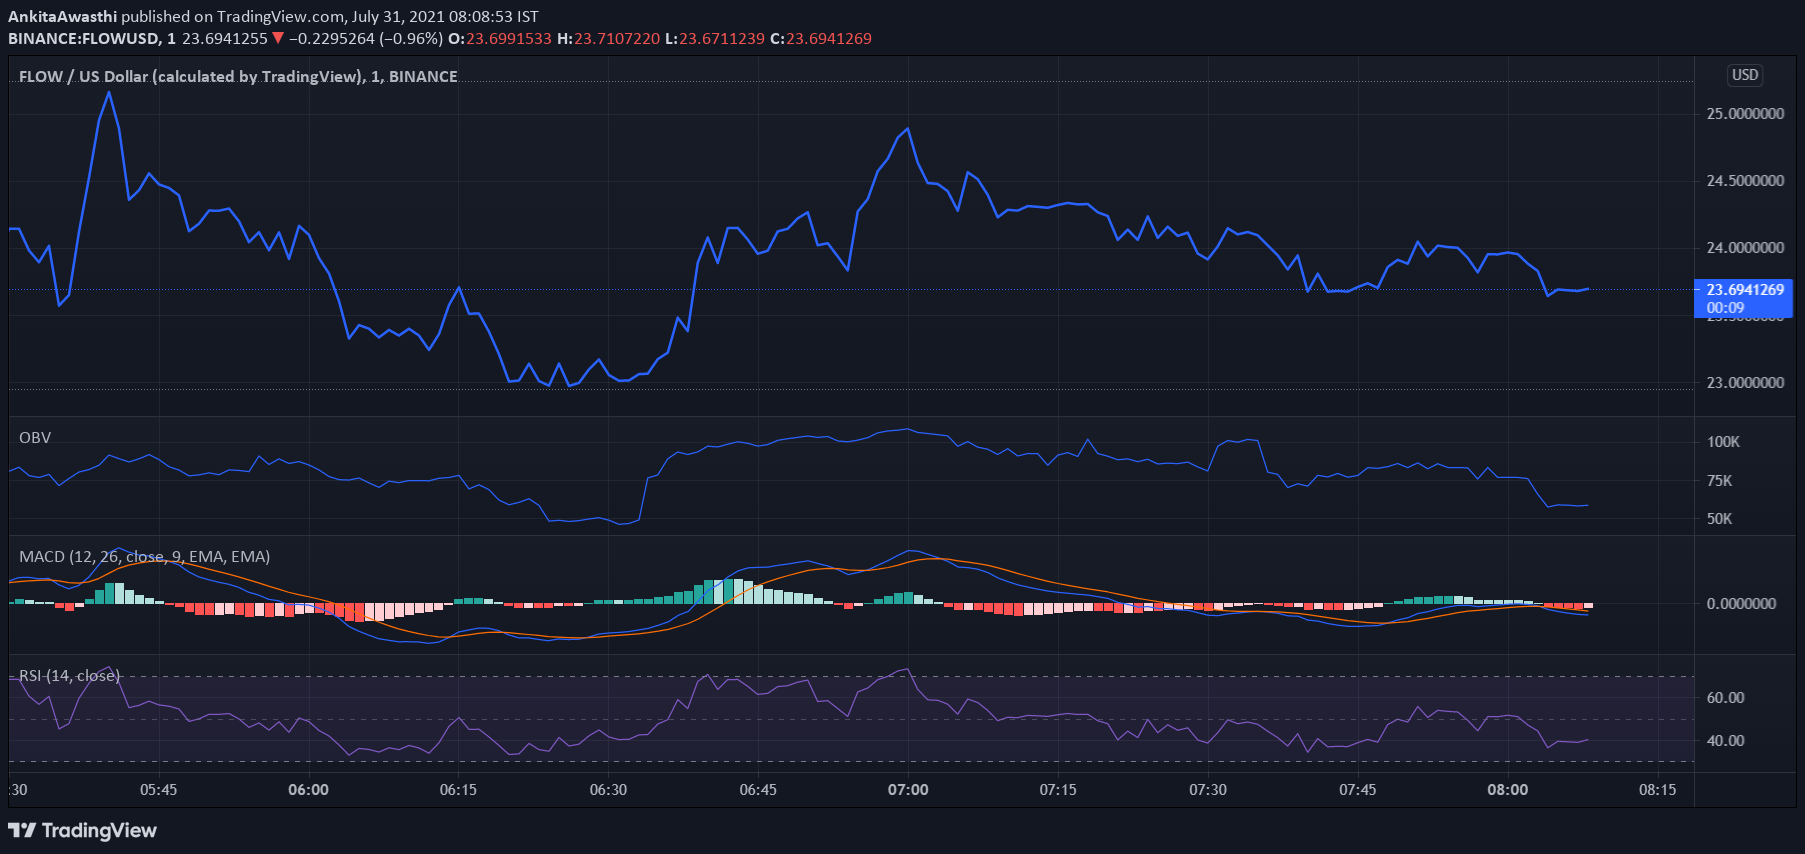
Currently, FLOW is trading at $23.69. The price hasn’t changed much from the day’s opening price of $23.70. Thus, the market seems neutral with equal buying and selling pressures.
The MACD and signal lines are negative. Moreover, a bearish crossover by the MACD line over the signal line has occurred. Thus, the overall market momentum is bearish. Hence, we can expect the price to go down.
Currently, the RSI indicator is at 50%. It faced rejection at 36% and rose to the current level. Hence, buying pressures are mounting. High buying activity will exert upward pressure on the FLOW price.
Besides, the OBV indicator has started rising steadily. Thus, buying volumes are higher than selling volumes. Hence, the price may go up.
In short, the MACD indicator has given negative signals, while the RSI and OBV indicators have given positive signals. Thus, we can expect intermittent price pullbacks amidst an overall bullish trend. The possibility of a bullish trend reversal cannot be ruled out too.
FLOW Technical Analysis
Currently, the price is above the first Fibonacci pivot support level of $19.30. The price may soon break out of the Fibonacci pivot point of $23.88. It may even surpass the first resistance level of $28.46. After that, we have to wait and watch if the price continues to rise or starts falling.
The price has tested and risen above the 38.2% FIB retracement level of $22.55. It may soon break out of the 23.6% FIB retracement level of $20.80. By day close, if the price retests and falls below these levels, the price downtrend is strong enough to sustain till tomorrow.