BitTorrent is an open-source file-sharing protocol that powers many decentralized apps too. The DApps supported by this network includes DLive, BitTorrent speed, BitTorrent file system, and much more. It also facilitates faster downloads. BTT is the prime governance token of this ecosystem. Let us look at the technical analysis for BTT.
Past Performance
On Jul 24, 2021, BTT opened at $0.0022. On Jul 30, 2021, BTT closed at $0.0029. Thus, in the past week, the BTT price has increased by roughly 32%. In the last 24 hours, BTT has traded between $0.0026-$0.0029.
https://s3.tradingview.com/snapshots/y/YfDYh2wd.png
Day-Ahead and Tomorrow
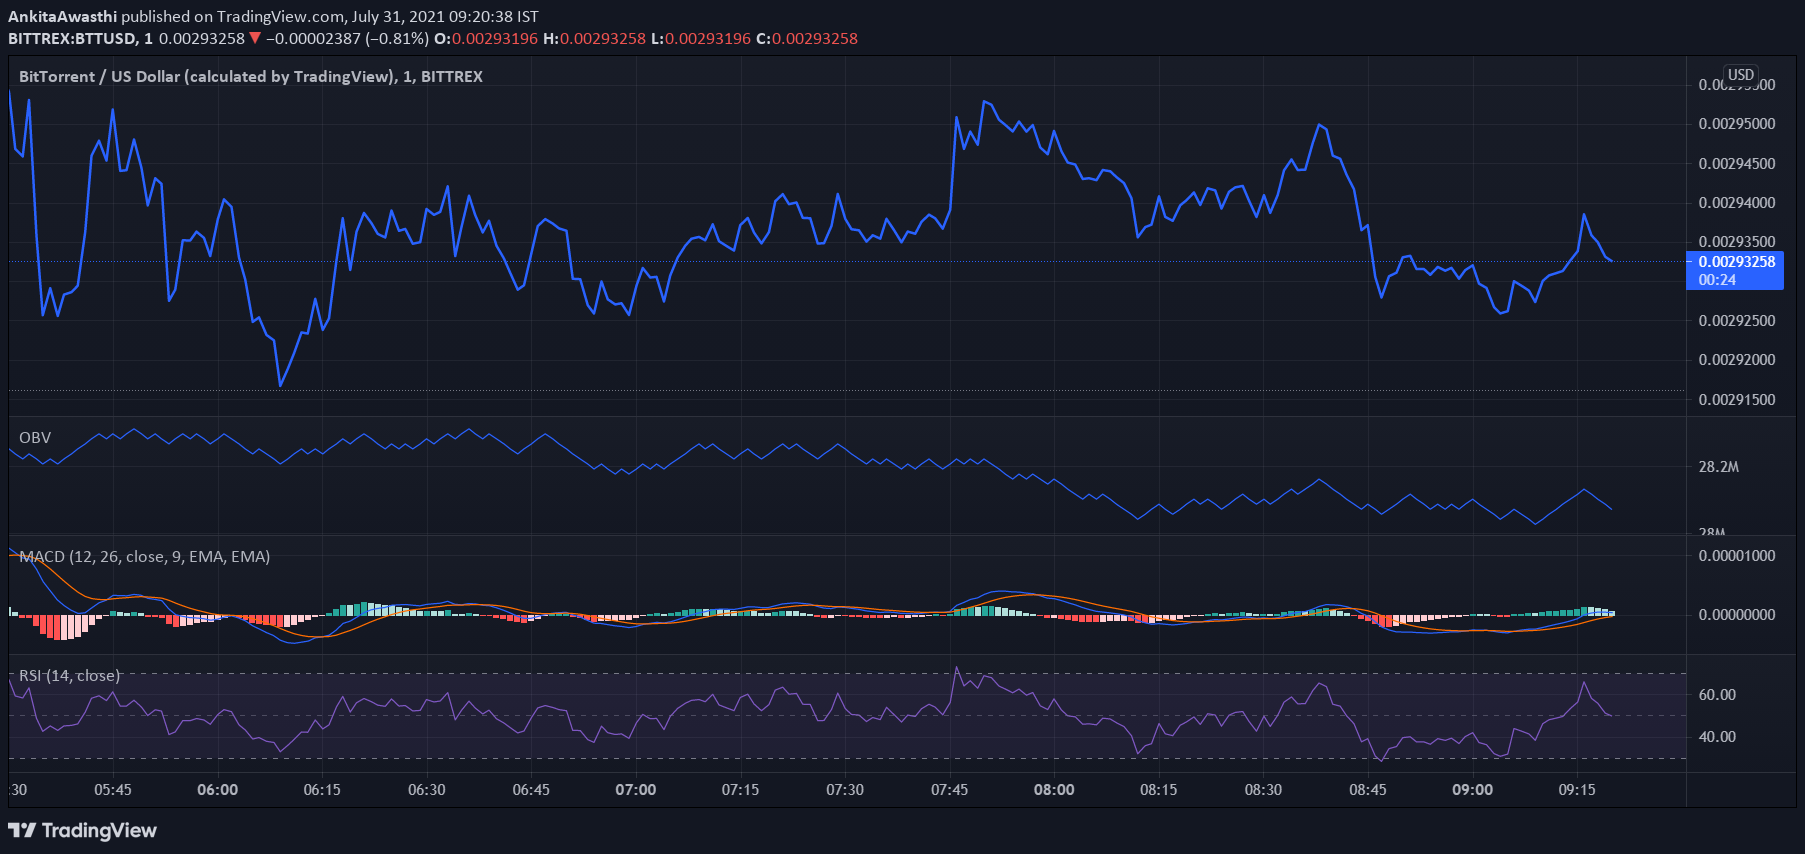
Currently, BTT is trading at $0.0029. The price hasn’t changed from the day’s opening price of $0.0029. Thus, the market seems neutral with equal buying and selling pressures.
The MACD and signal lines are turning positive. Moreover, a bullish crossover by the MACD line over the signal line has occurred. Thus, the overall market momentum is turning bullish. Hence, we can expect the price to go up further.
Currently, the RSI indicator is at 42%. It faced rejection at 37% and rose to the current level. Hence, buying pressures are mounting. High buying activity will exert upward pressure on the BTT price.
However, the OBV indicator is downward sloping. Thus, selling volumes are higher than buying volumes. Hence, the price may start falling.
In a nutshell, the OBV indicator has given negative signals, while the MACD and RSI indicators have given positive signals. Thus, the overall price trend seems bullish. We have to wait and watch if the intermittent price pullbacks are price corrections or the beginning of a trend reversal.
BTT Technical Analysis
Currently, the price is above the first Fibonacci pivot resistance level of $0.0029. The price may further rise above the second Fibonacci pivot resistance level of $0.003. After that, we have to wait and watch if the price continues to rise or starts falling.
The price may soon test and rise above the 138.2% FIB retracement level of $0.003. By day end, if the price retests and falls below the 23.6% FIB retracement level of $0.0027, a price downtrend has probably set in. In that case, the price downswing is likely to continue tomorrow as well.