Stellar (XLM) has been moving downwards since May but briefly reversed its trajectory and rebounded on June 22.
XLM has created a bullish pattern and is now aiming for the closest resistance levels.
Long-term XLM support levels
XLM had been moving downwards since May 10, after it reached a high of $0.80. The downward move continued until a low of $0.195 was reached on June 22.
The low was made at the 0.786 Fib retracement support level at $0.192. This is also a strong horizontal support area. The subsequent bounce confirmed this
However, despite the increase, technical indicators in the weekly time-frame are still bearish. The RSI is below 50, the Stochastic oscillator has made a bearish cross, and the MACD is nearly negative.

Breakout and double bottom
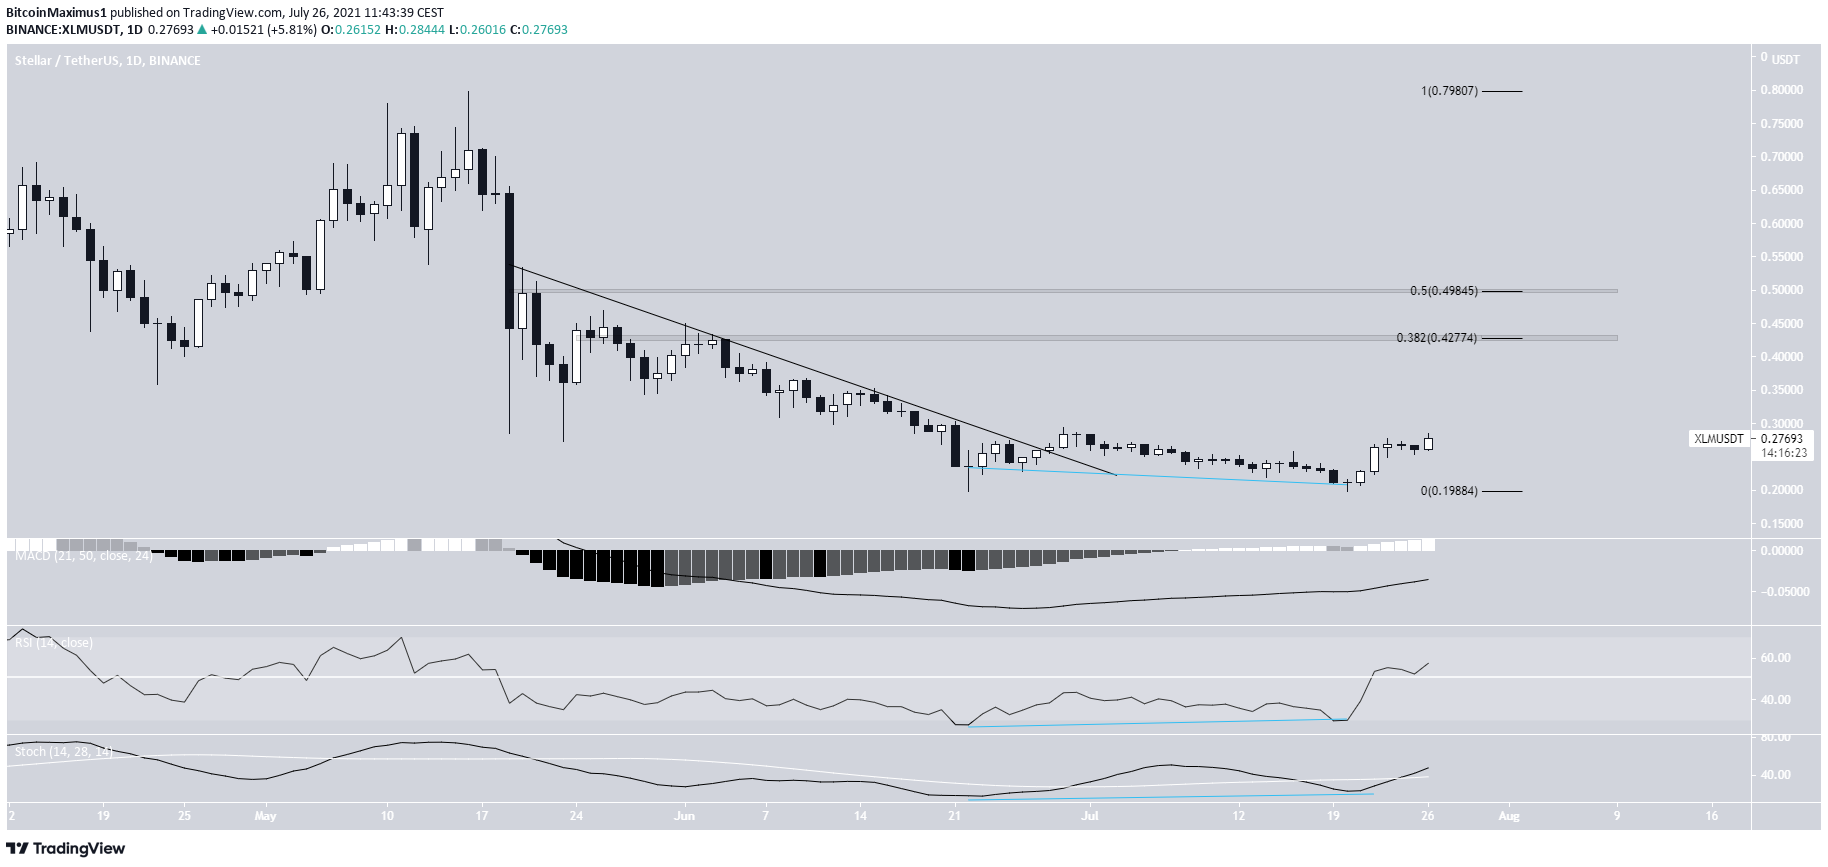
The daily chart is more bullish than the weekly outlook.
XLM broke out from a descending resistance line after making the June 22 low. Afterward, it returned near the same level on July 20, creating a double bottom pattern.
Besides being a bullish pattern, the double bottom was combined with bullish divergences in the MACD, RSI, and Stochastic oscillator.
The closest resistance areas are found at $0.427 and $0.498. These are the 0.382 and 0.5 Fib retracement resistance levels.
Wave count
Cryptocurrency trader @TheTradingHubb outlined a XLM chart, stating that the price is approaching a resistance area near $0.29,
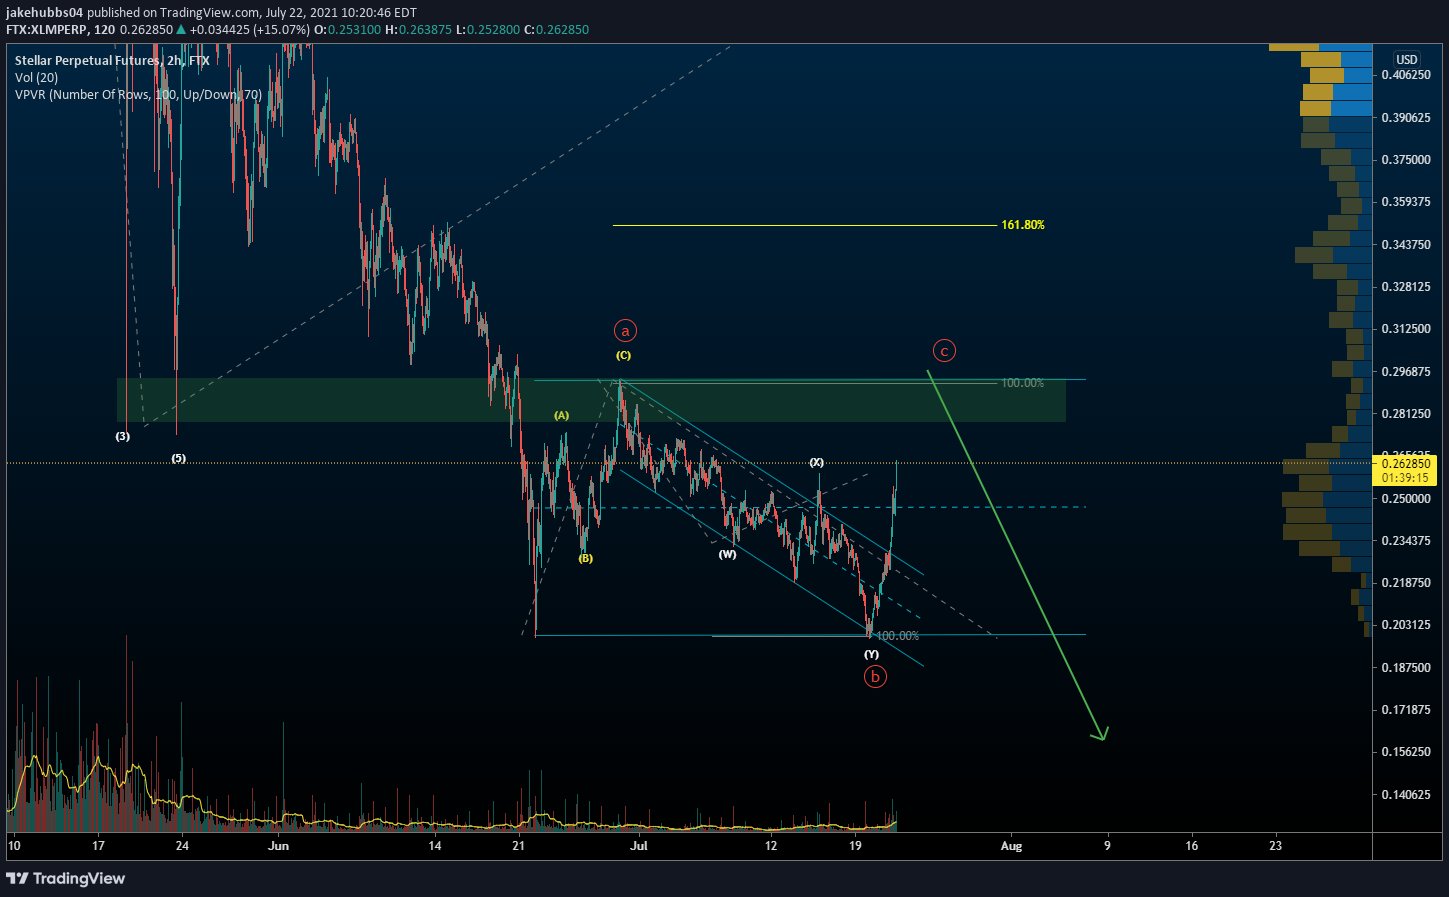
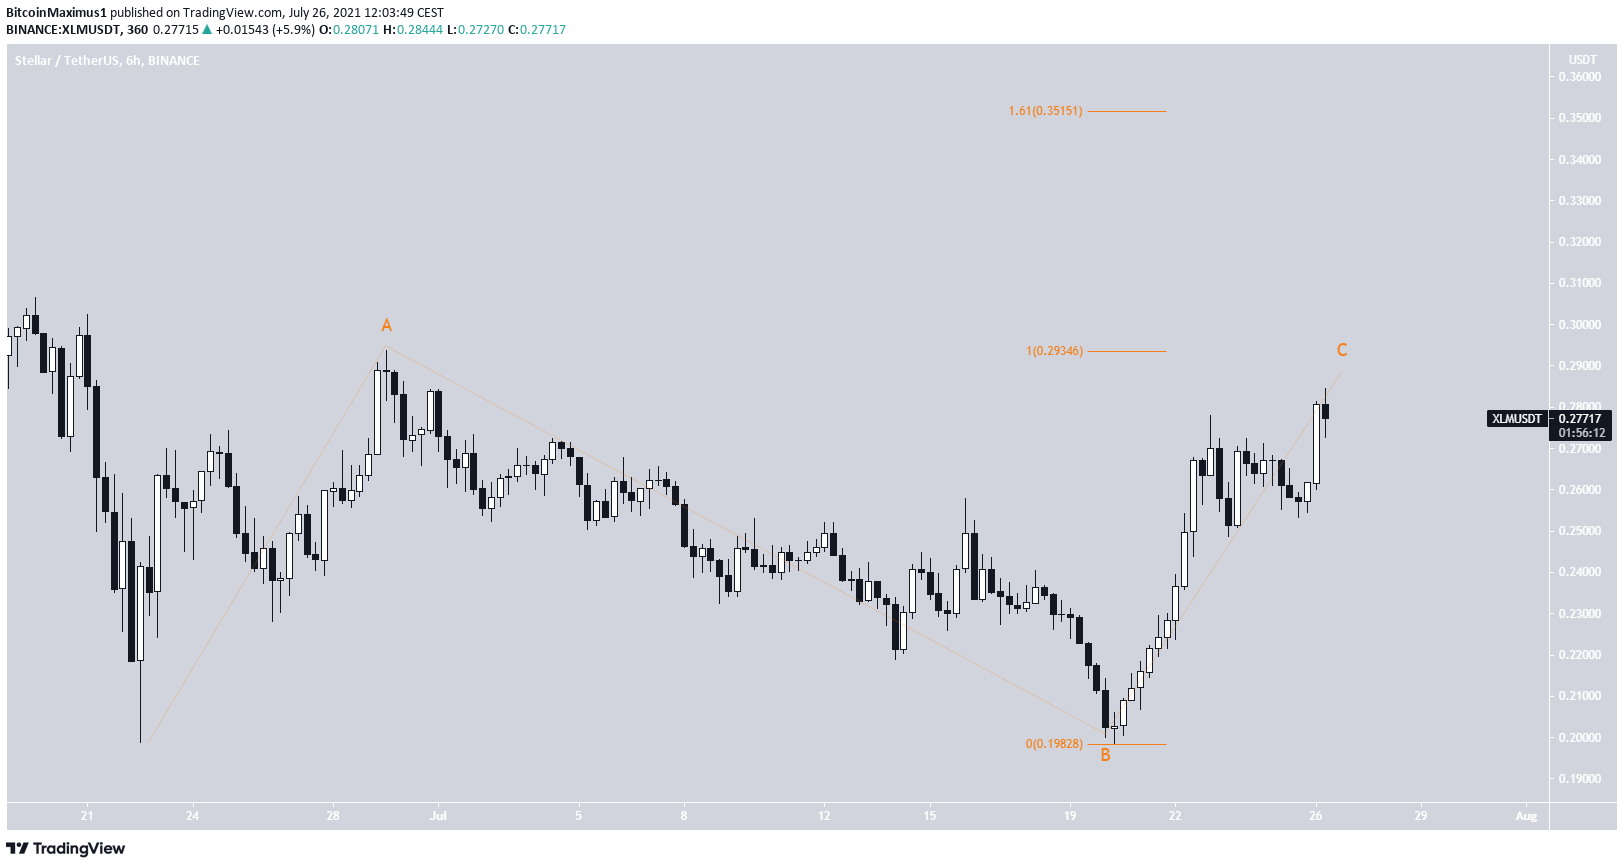
If the movement is indeed a flat A-B-C corrective structure, XLM would be expected to reach a top near the $0.292 level. This would give waves A:C a 1:1 ratio.
The next most likely level for the top of the C wave would be $0.35. This would g giving waves A:C a 1:1.61 ratio. Neither of these targets would reach any of the resistance levels previously outlined. This casts some doubt on the possibility that this is an A-B-C flat structure.
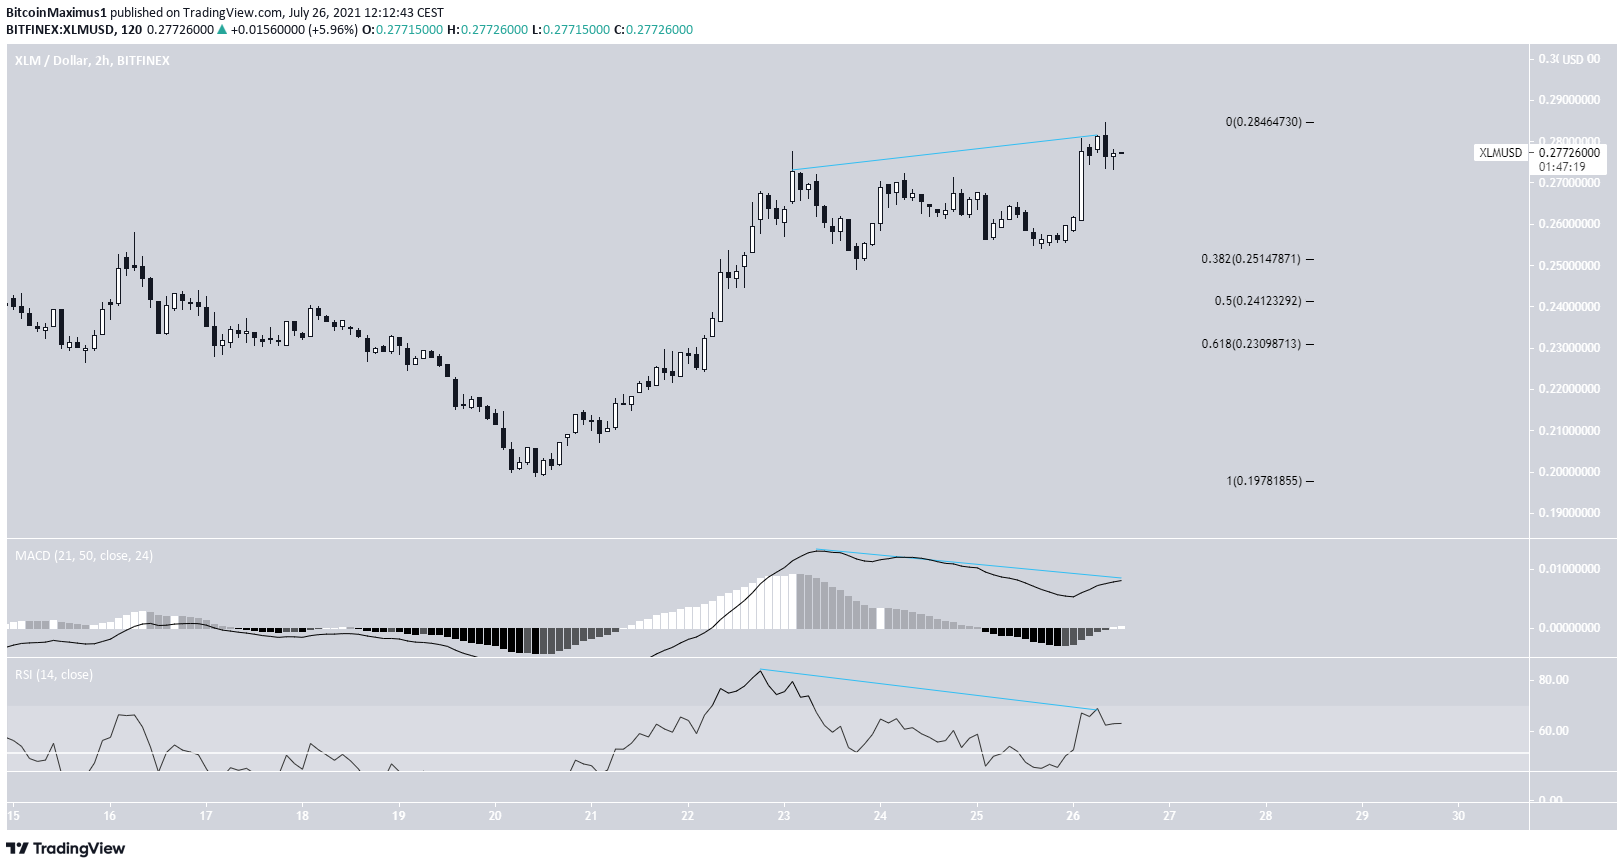
In any case, the two-hour chart is showing weaknesses, warning of an impending rejection.
There are significant bearish divergences developing in both the MACD and RSI.
If XLM breaks down, the closest support levels are found at $0.251, $0.241, and $0.231.
For BeInCrypto’s latest bitcoin (BTC) analysis, click here.