The Quant Network has pioneered the development of Overledger DLT gateway — the first enterprise-grade DLT gateway in the world. This gateway ensures enterprises achieve interoperability across multiple blockchains, systems, and DLTs. It is a speedy, easy-to-use, and secure ecosystem. QNT is the prime governance token of this network.Let us look at the technical analysis for QNT.
Past Performance
On Jul 19, 2021, QNT opened at $70. On Jul 25, 2021, QNT closed at $96. Thus, in the past week, the QNT price has increased by roughly 37%. In the last 24 hours, QNT has traded between $82.46-$99.72.
https://s3.tradingview.com/snapshots/u/UopZuFY2.png
Day-Ahead and Tomorrow
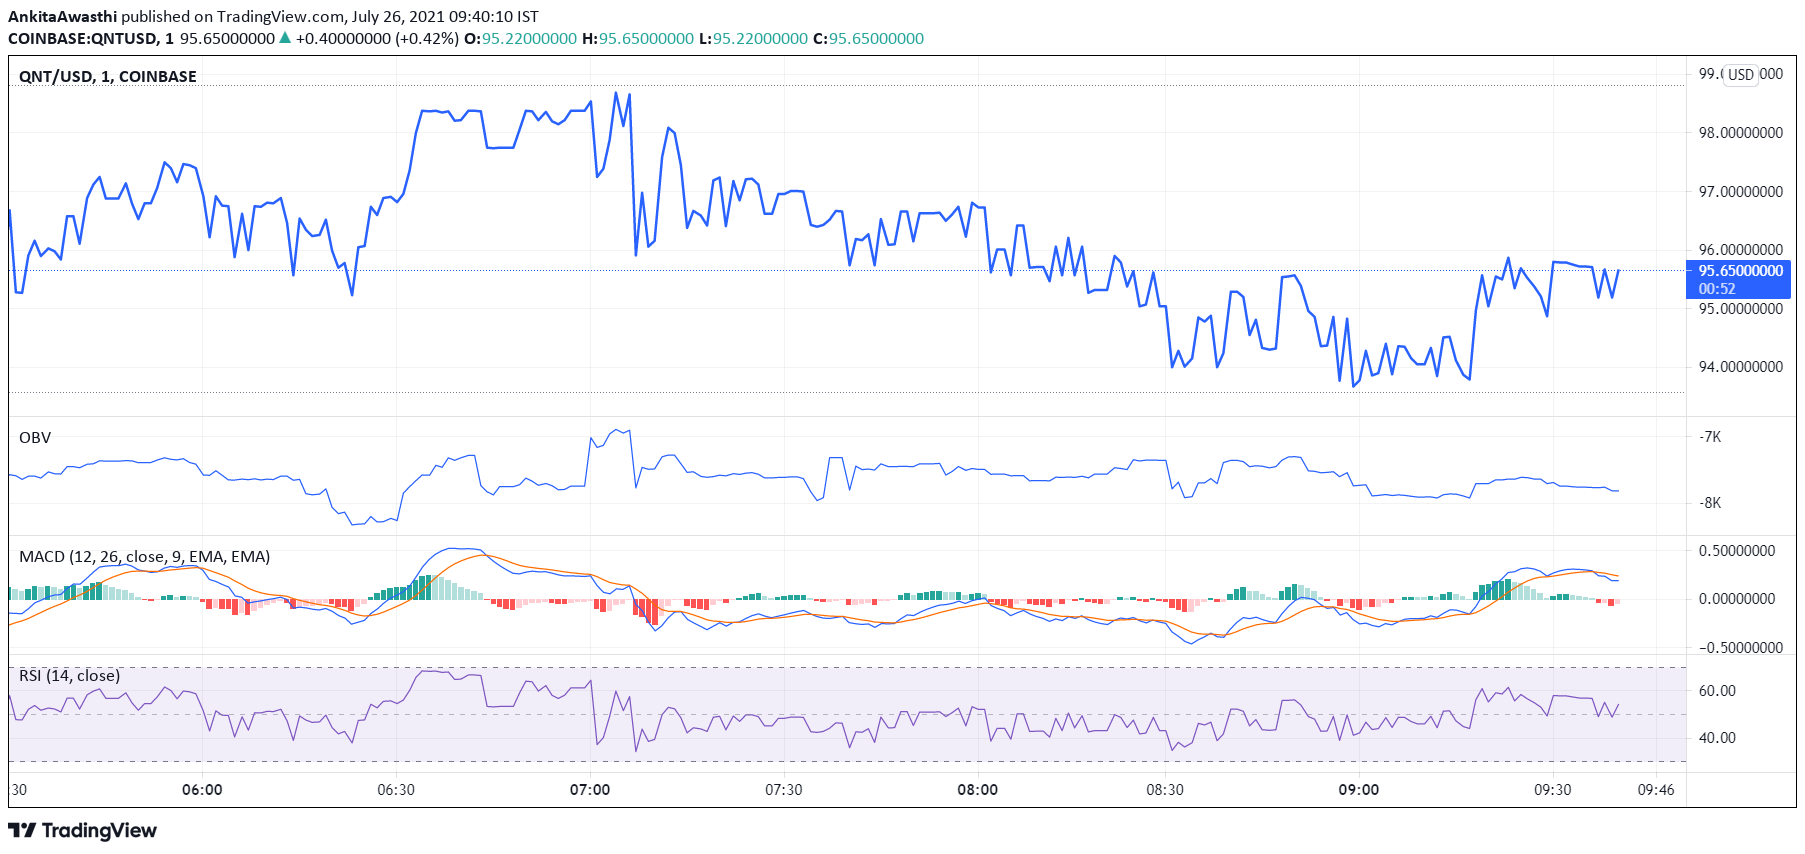
Currently, QNT is trading at $95.65. The price has decreased from the day’s opening price of $96. Thus, the market seems bearish.
The MACD and signal lines are positive. Thus, the overall market momentum is bullish. However, a bearish crossover by the MACD line over the signal line has occurred. Hence, we can expect an intermittent price pullback amidst an overall bullish trend.
Currently, the RSI indicator is at 53%. It faced rejection at 47% and rose to the current level. Hence, buying pressures are high. High buying activity will exert upward pressure on the QNT price.
Besides, the OBV indicator is falling steadily. Thus, selling volumes are gradually surpassing buying volumes. Hence, the price may decrease further.
In short, when we look at all three indicators together, we can say that the overall market momentum is bullish. However, we have to wait if price pullbacks are temporary market corrections or the beginning of a trend reversal.
QNT Technical Analysis
Currently, the price is above the Fibonacci pivot point of $92.73. The price may soon surpass the first Fibonacci pivot resistance level of $99.32. Thereafter, we have to wait and watch if the price rises further or starts falling.
Presently, the price has surpassed the 61.8% FIB retracement level of $93.13. It may soon break out of the 23.6% FIB retracement level of $95.65 as well. If by day end, the price retests and falls below these levels, a price downtrend has probably set in. In that case, the price may decline further tomorrow.