Matic Network/Polygon is an open-source protocol that imparts high scalability to the Ethereum blockchain. It uses PoS-based sidechains and Plasma technology to facilitate fast and safe transactions on Ethereum. It also provides a robust platform for the creation of innovative dApps. MATIC is the utility token of this network. Let us look at the technical analysis of MATIC.
Past Performance
On Jul 17, 2021, MATIC opened at $0.81. On Jul 23, 2021, MATIC closed at $0.95. Thus, in the past week, the MATIC price has increased by roughly 17%. In the last 24 hours, MATIC has traded between $0.86-$0.96.
https://s3.tradingview.com/snapshots/t/TDhnFRFf.png
Day-Ahead and Tomorrow
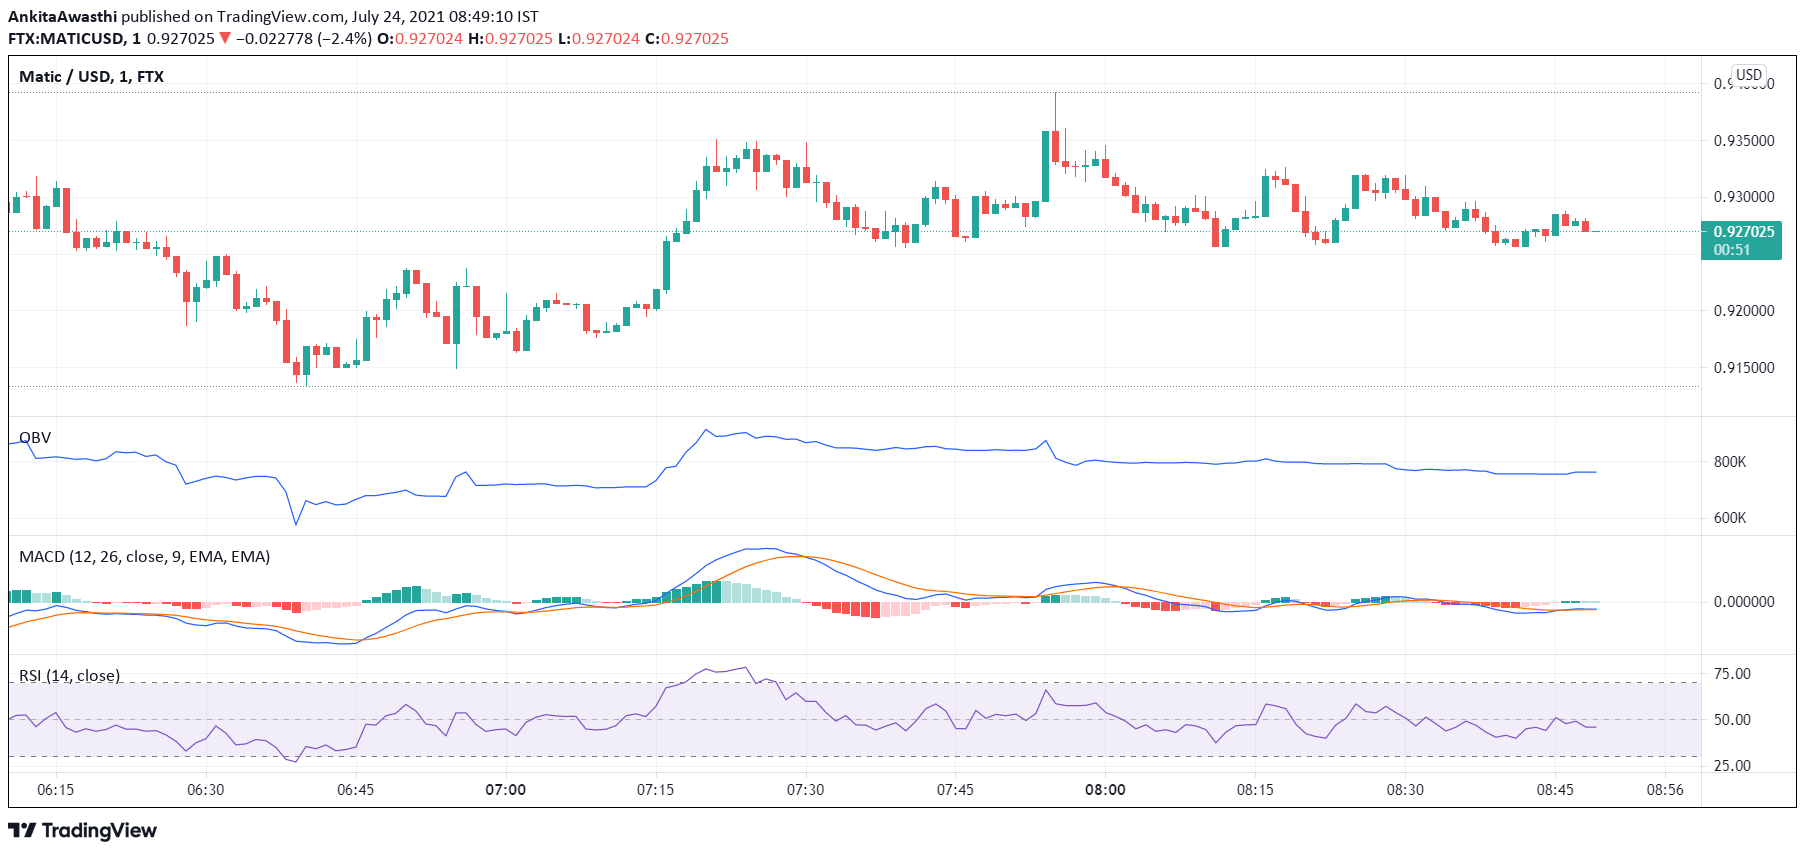
Currently, MATIC is trading at $0.93. The price has decreased from the day’s opening price of $0.95. Thus, the market seems bearish.
The MACD and signal lines are negative. Thus, the overall market momentum is bearish. However, a bullish crossover by the MACD line over the signal line has occurred. Hence, we can expect an intermittent price rise amidst an overall bearish trend.
Currently, the RSI indicator is at 50%. It faced rejection at 42% and rose to the current level. Hence, buying pressures are mounting. High buying activity will exert upward pressure on the MATIC price.
But, the OBV indicator is downward sloping. Thus, selling volumes are higher than buying volumes. Hence, the price may fall further.
In short, when we look at all three oscillators together, we can say that the overall market momentum is bearish. But, a trend reversal may be on the anvil.
MATIC Technical Analysis
Currently, the price is below the first Fibonacci pivot resistance level of $0.95. The price may soon fall below the Fibonacci pivot point of $0.92 as well. Thereafter, we have to wait and watch if the bearish forces remain strong or a trend reversal occurs.
The price has tested and fallen below the 76.4% FIB retracement level of $0.94. It may further fall below the 61.8% FIB retracement level of $0.92. If the price retests and breaks out of these levels by day close, a bullish trend has probably set in. In that case, the price may continue to upswing tomorrow as well.