The Dogecoin (DOGE) price has been moving downwards since reaching a new all-time high price on May 8.
The token stopped its descent with a strong bounce on July 21 and has created a short-term bullish pattern, which could lead to a strong bounce.
DOGE finds support
DOGE was subject to a massive price increase beginning in March 2020, which led to the $0.74 all-time high price on May 8, 2021.
In a span of slightly more than a year, the token increased by 65,122%.
However, it has been moving downwards since the all-time high was reached.
On July 20, it reached a low of $0.159. The low was made very close to the 0.786 Fib retracement support level at $0.157, a likely area for a bounce.
Technical indicators are relatively neutral, though they are showing some bearish signs. While the MACD is decreasing, it is still positive. The RSI is right at the 50 line. However, the Stochastic oscillator has made a bearish cross.
The next support is all the way down at $0.08.
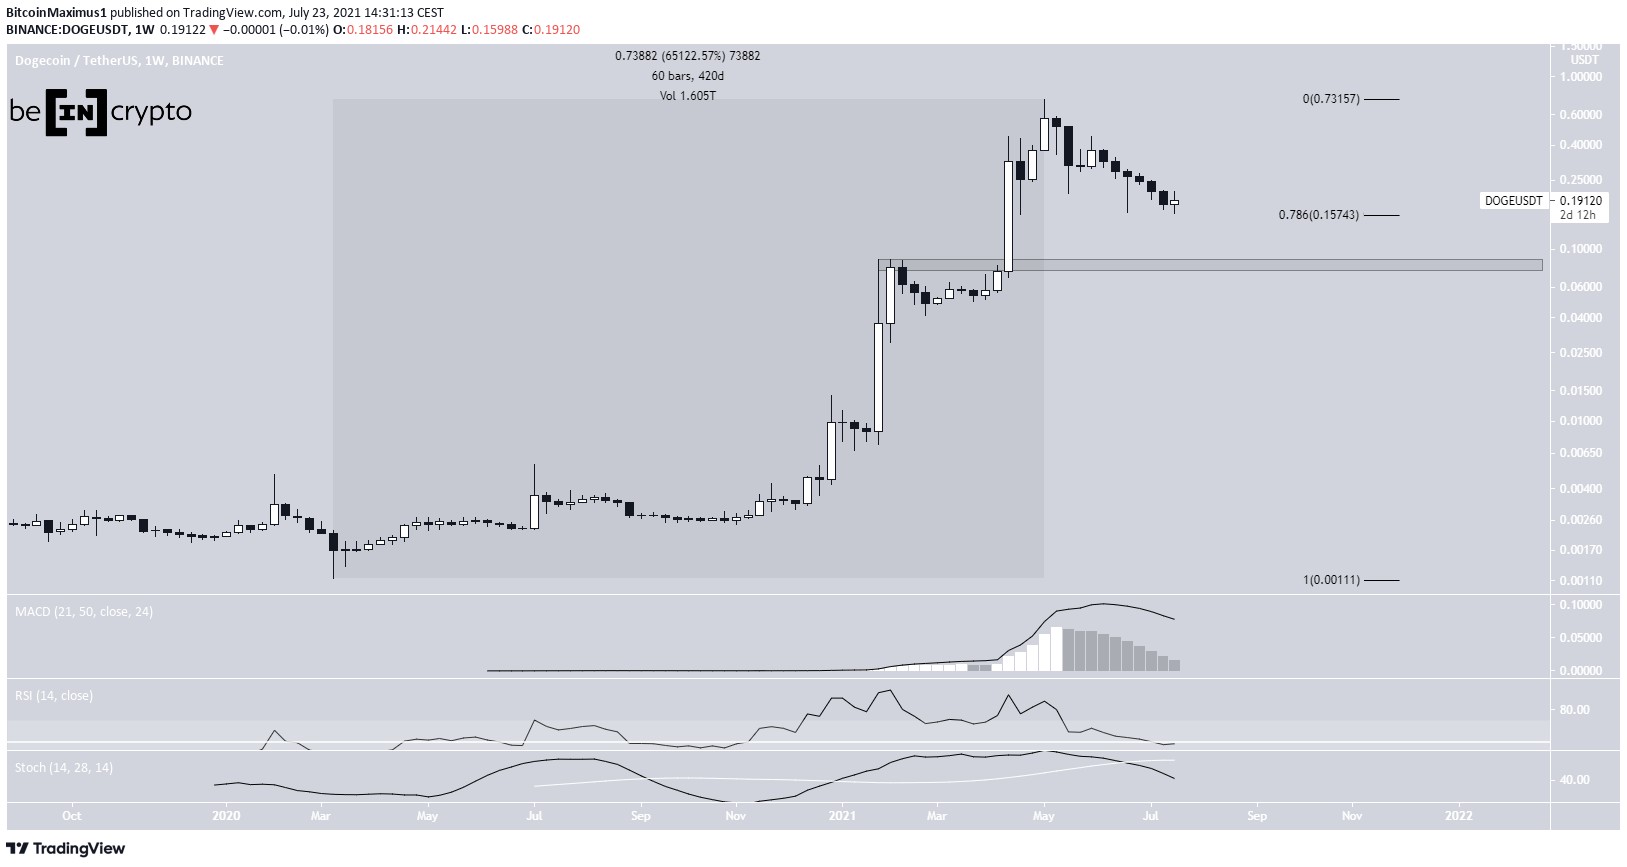
The logarithmic chart is used in the image above in order to better visualize large price fluctuations.
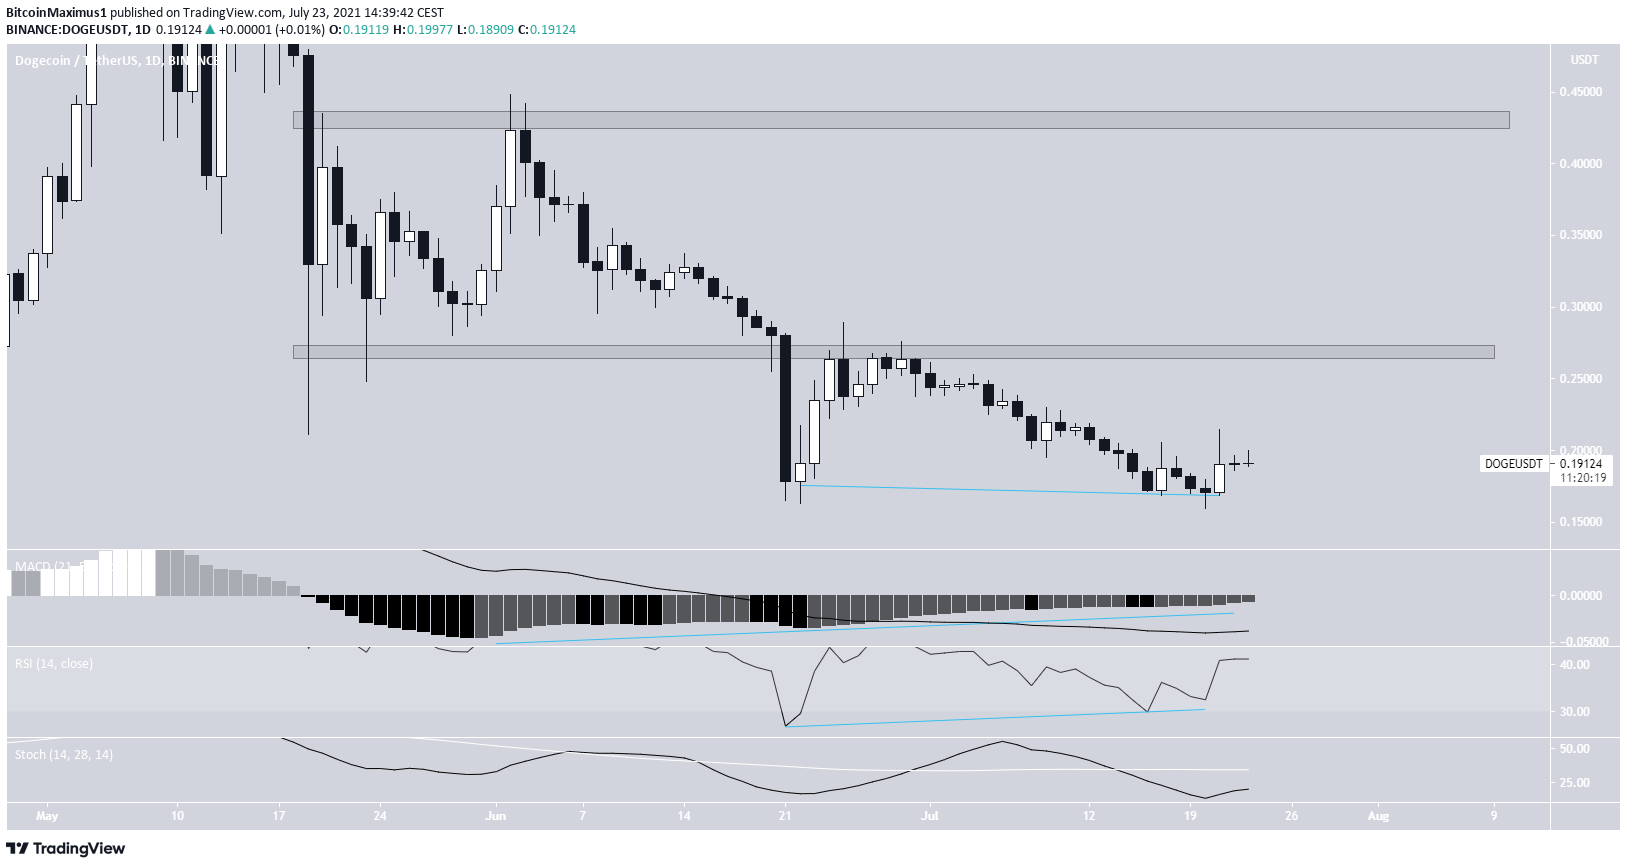
Double bottom leads to bounce?
The daily chart supports the possibility that DOGE will bounce from the current level.
On June 22 and July 20, DOGE created a double bottom, which is known as a bullish reversal pattern. Furthermore, the pattern was combined with bullish divergences in the RSI & MACD. Therefore, an upward movement is likely.
The closest resistance levels are at $0.27 and $0.43, both being horizontal resistance areas.
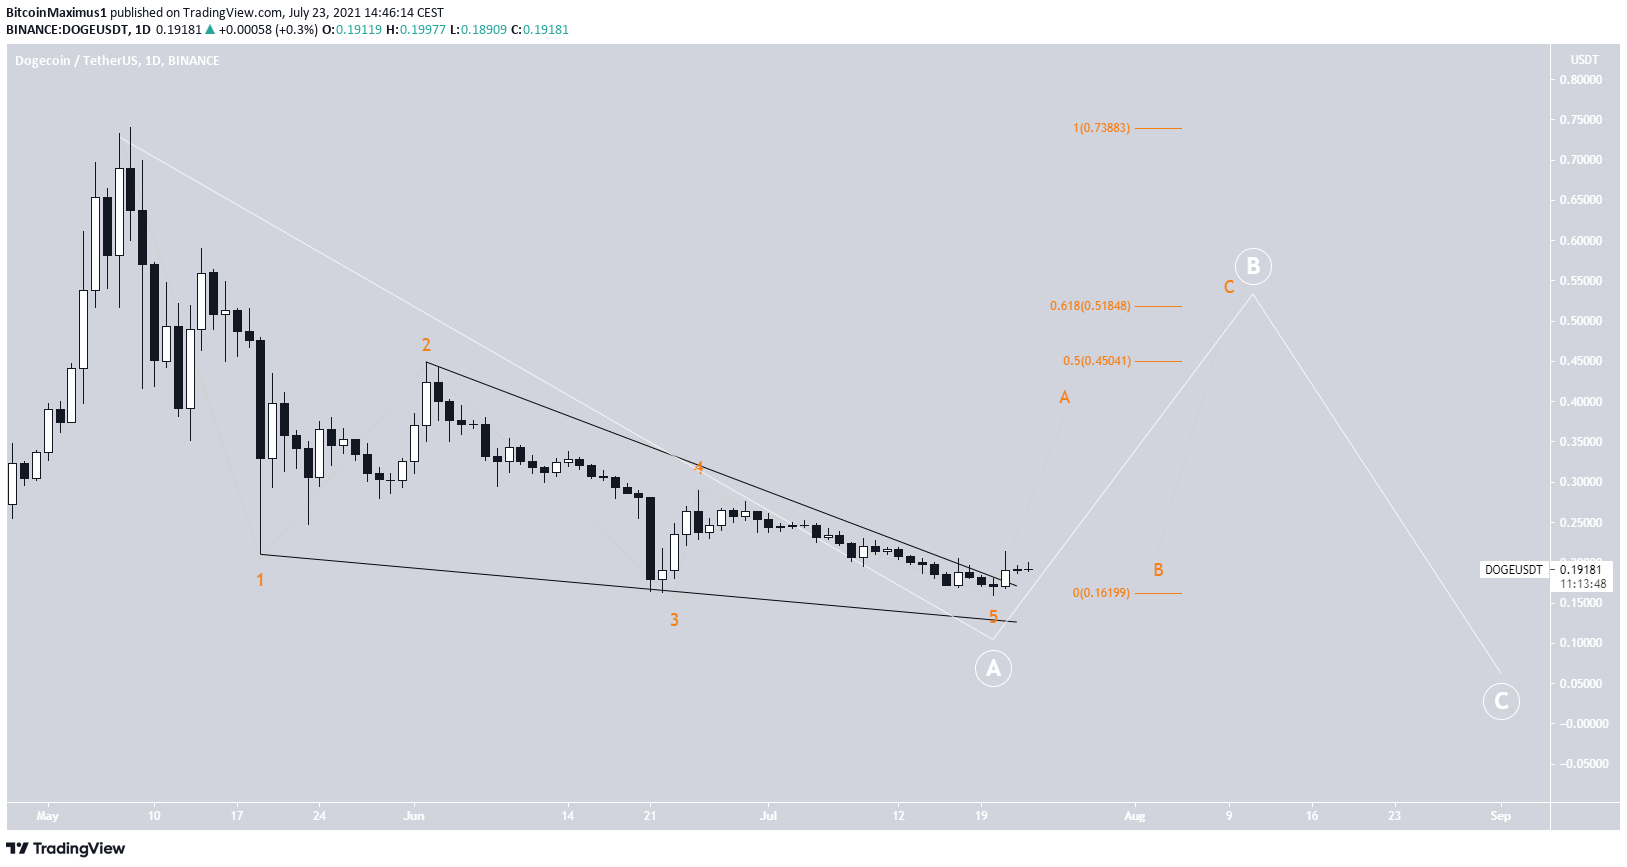
Wave count
Cryptocurrency trader @Thetradinghubb outlined a DOGE chart, stating that the token is likely to bounce towards $0.45 before another eventual fall.

The descent from the all-time highs resembles a leading diagonal, which was likely the A wave of an A-B-C corrective structure (white).
DOGE has broken out from the wedge, likely beginning wave B in the process.
Since the descent was a five wave structure, the most likely level for the top of the ensuing correction is between the 0.5-0.618 Fib retracement resistance levels at $0.45-0.52.
Nevertheless, a more accurate target will likely present itself once the corrective structure begins to form.