Waves is a robust open-source protocol that facilitates the creation of innovative decentralized applications for practical daily use. It provides a user-friendly development infrastructure with ready-to-use app-building tools. Apart from that, developers can access development libraries, guides, learning materials, and tutorials on the waves.campus. WAVES is the in-house token of this ecosystem.
Past Performance
On Jul 15, 2021, WAVES opened at $13.59. On Jul 21, 2021, WAVES closed at $12.73. Thus, in the past week, the WAVES price has decreased by roughly 6%. In the last 24 hours, WAVES has traded between $12.08-$12.94.
https://s3.tradingview.com/snapshots/5/5tmJwmGW.png
Day-Ahead and Tomorrow
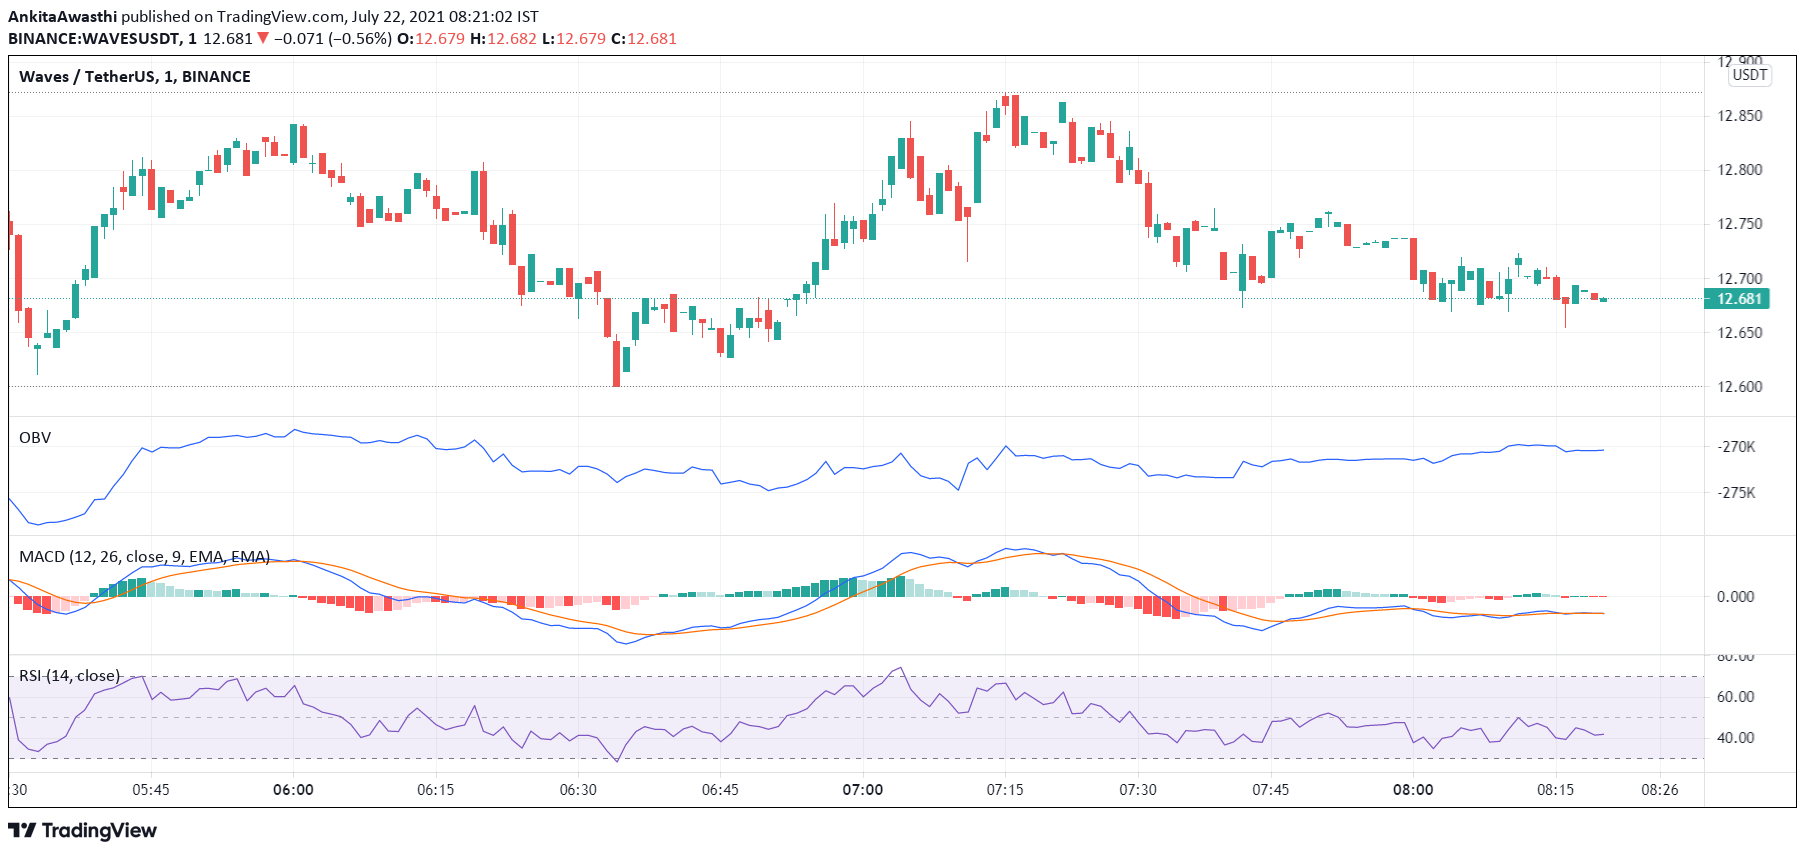
Currently, WAVES is trading at $12.68. The price has decreased from the day’s opening price of $12.73. Thus, the market seems bearish.
The MACD and signal lines are negative. Thus, the overall market momentum is bearish. However, a bullish crossover by the MACD line over the signal line has occurred. Hence, we can expect price corrections amidst an overall bearish trend.
Currently, the RSI indicator is at 60%. It faced rejection at 40% and rose to the current level. Hence, buying pressures are high. High buying activity will exert upward pressure on the WAVES price.
Besides, the OBV indicator is upward sloping. Thus, buying volumes are higher than selling volumes. Hence, the price may start rising soon.
In short, all three indicators have pointed towards a price rise. However, we have to wait and watch if the price rise is an intermittent price adjustment or indicative of a bearish trend reversal.
WAVES Technical Analysis
Currently, the price is above the Fibonacci pivot point of $12.58. The price may soon breach the first Fibonacci pivot resistance level of $12.91. Thereafter, we have to wait and watch if the price continues to rise or starts falling again.
Currently, the price is above the 61.8% FIB retracement level of $12.61. It may soon break out of the 76.4% FIB retracement level of $12.74. If the price retests and falls below these levels by day close, then probably a price downtrend has set in. In that case, the price decline may continue tomorrow as well.