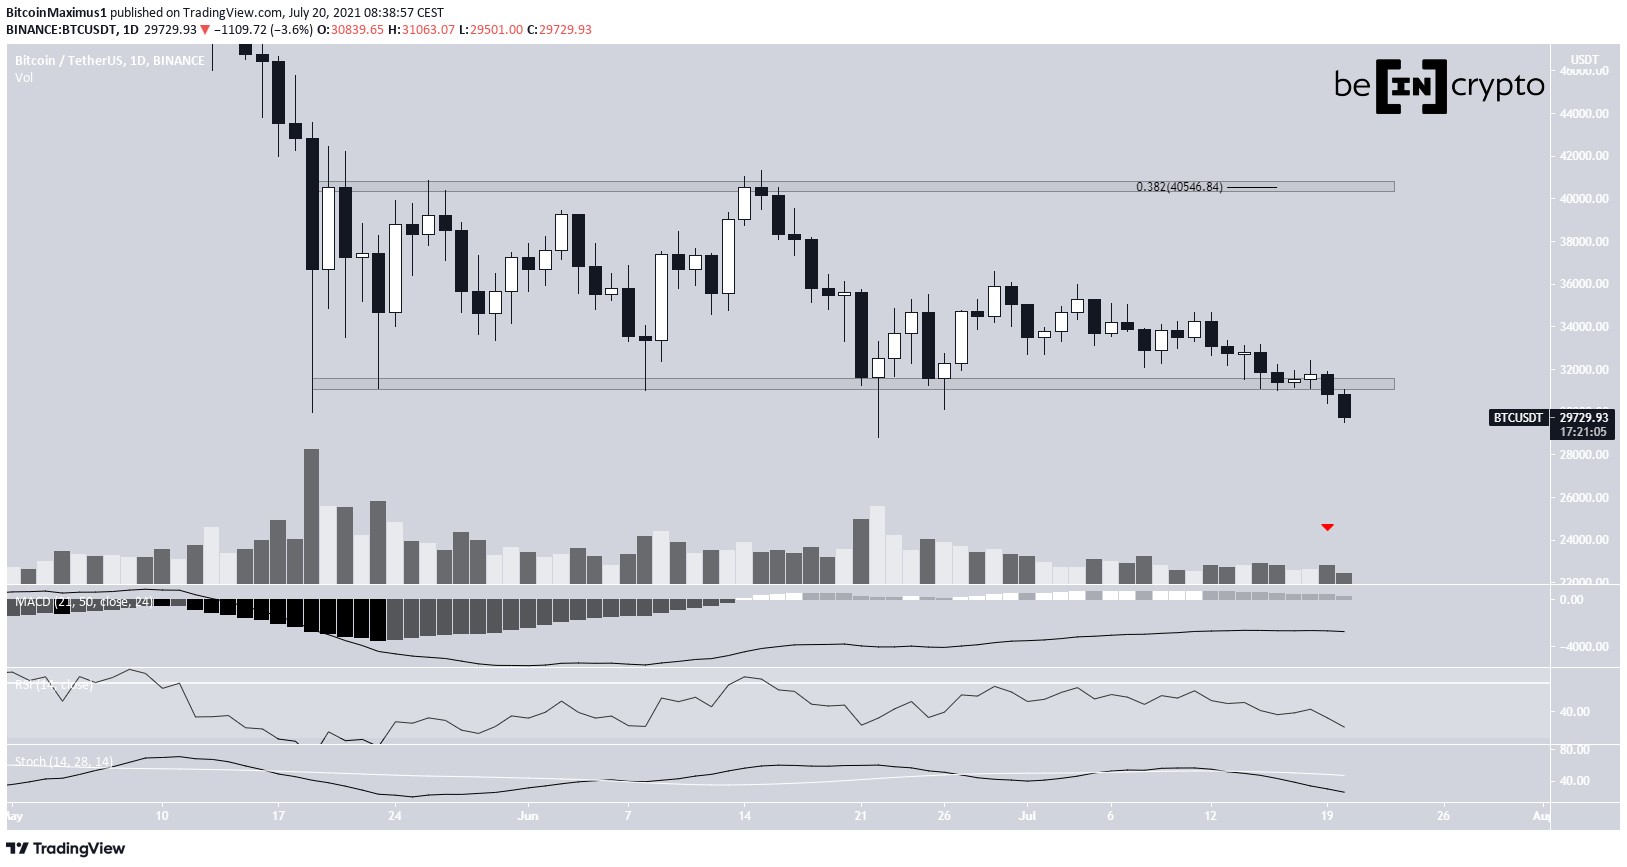
Bitcoin (BTC) has fallen below the $30,300 support area.
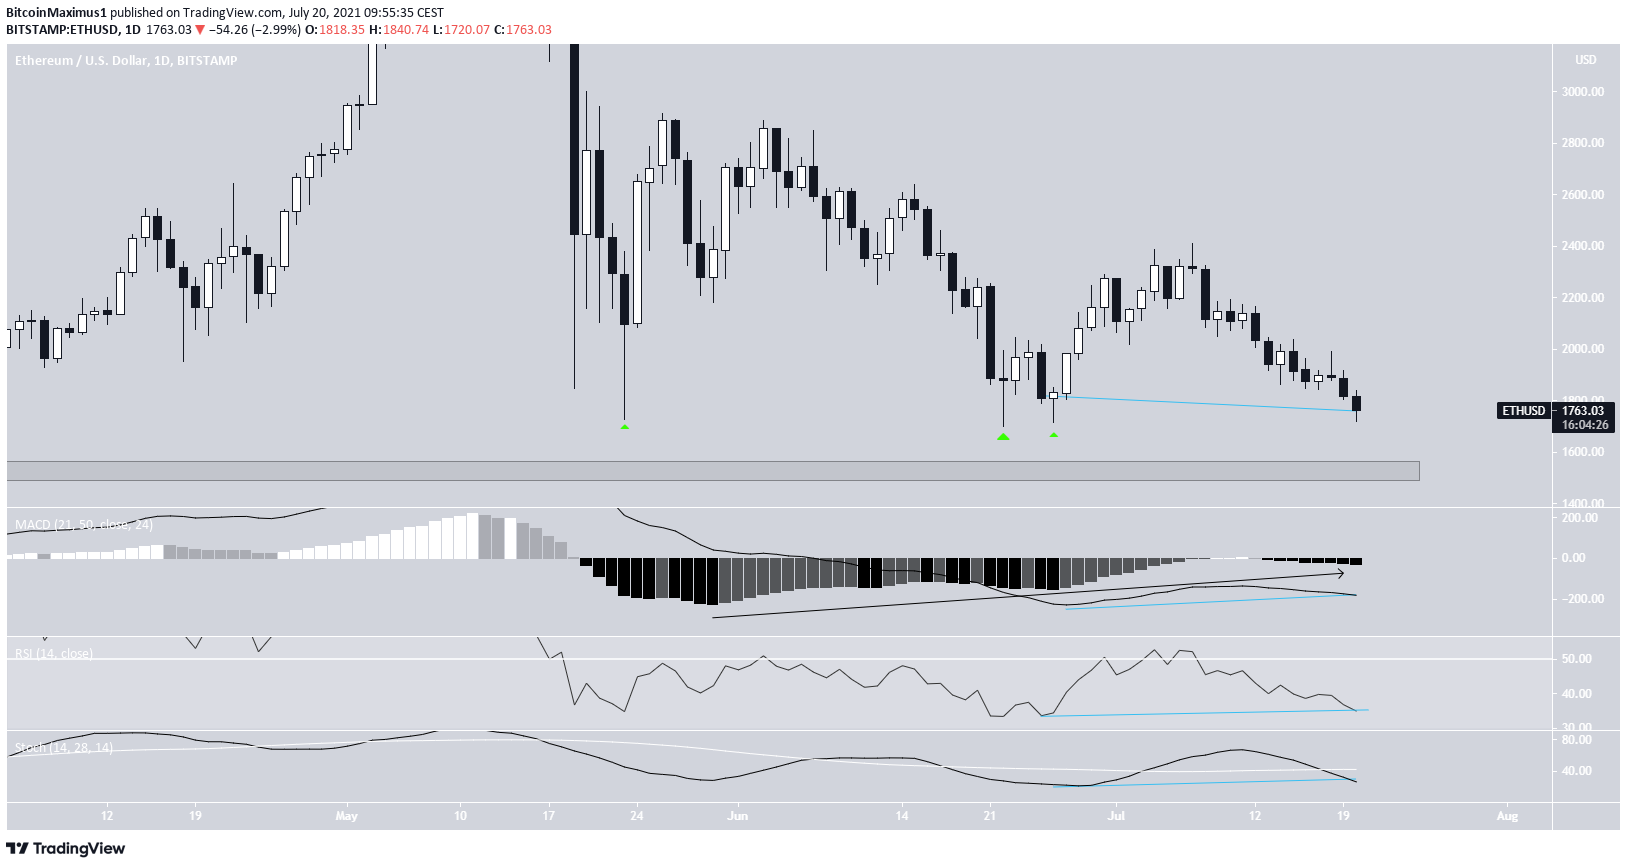
Ethereum (ETH) is approaching the $1,500 horizontal support area.
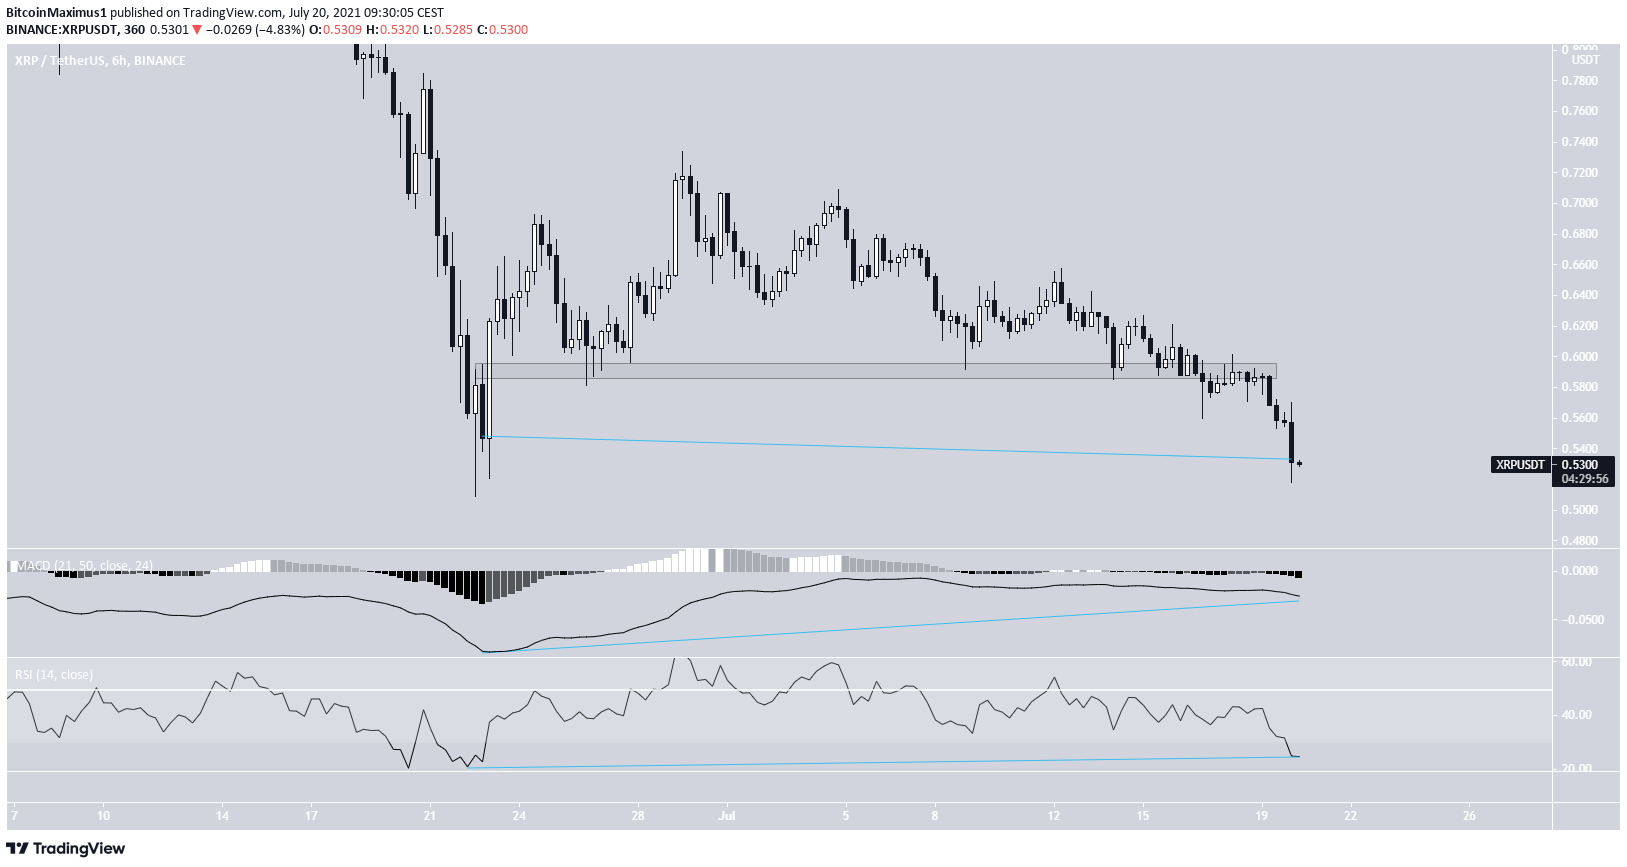
XRP (XRP) has fallen below the $0.59 area but could potentially create a double bottom pattern.
Dash (DASH) increased by 71% on July 19 but fell shortly afterwards, creating a long upper wick with a magnitude of 27%.
Compound (COMP) is trading inside a horizontal and Fib support area.
Enjin Coin (ENJ) is trading inside a symmetrical triangle.
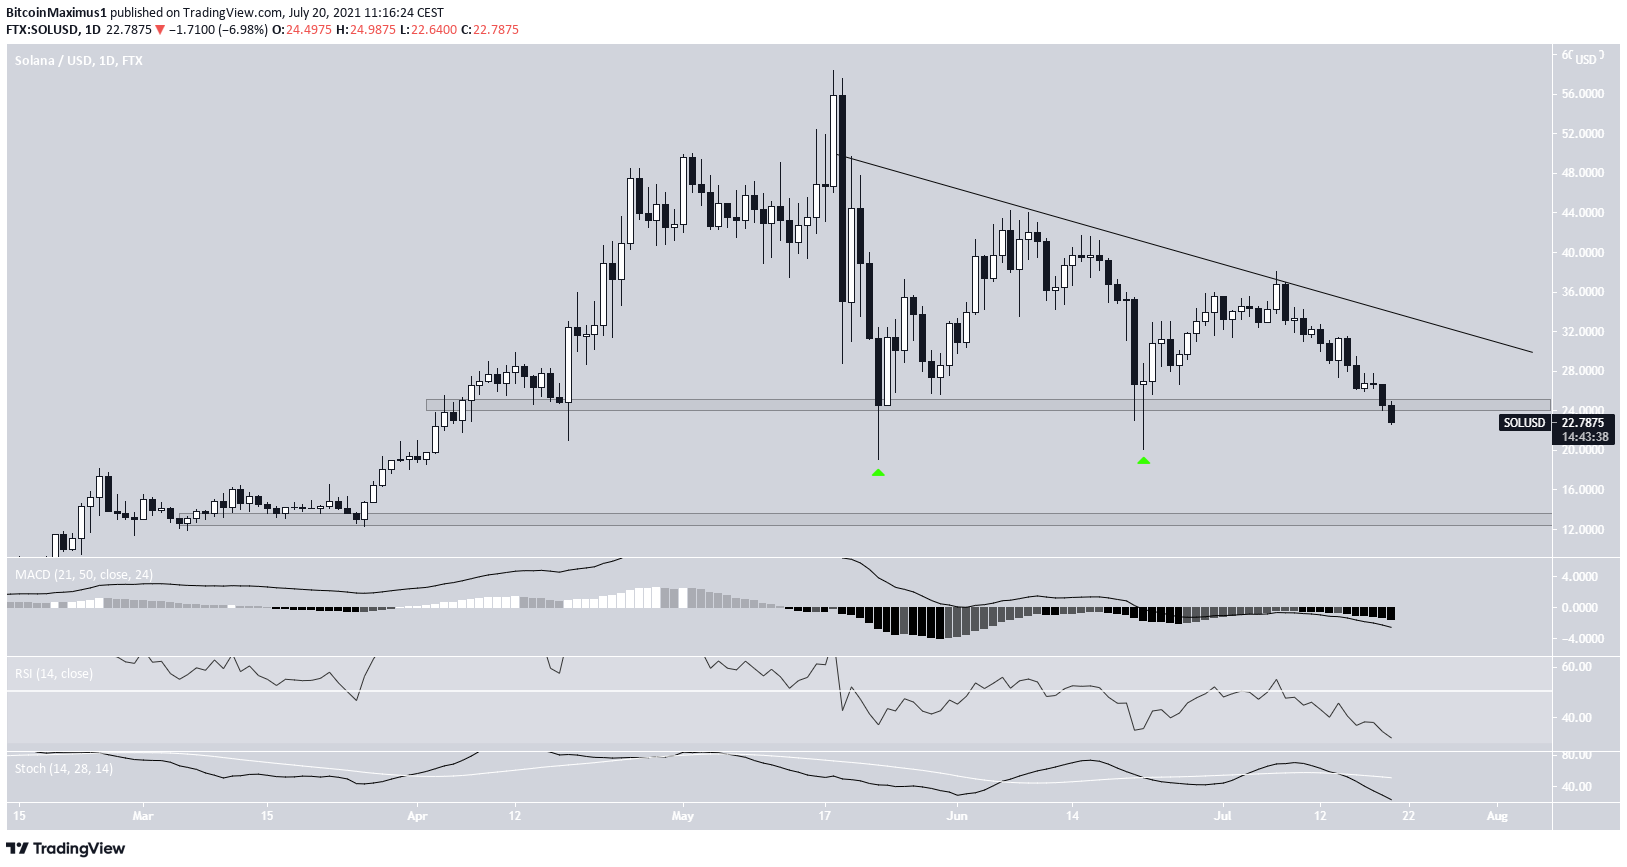
Solana (SOL) is trading inside a descending triangle.
BTC
Since reaching a low on May 19, BTC had been consolidating inside a range between $30,300 and $40,550.
While it did decrease below the former on a few occasions, it did not reach a daily close below the area. However, the July 19 close of $30,839 was the first close below support since the creation of the range.
While the breakdown transpired with low volume, technical indicators are bearish. The RSI, MACD, and Stochastic oscillator are all falling.
ETH
ETH bounced on May 23 after reaching a low of $1,730. The bounce created a long lower wick — a common sign of buying pressure.
It returned to this level on June 22 and 26, creating similar long lower wicks before bouncing.
However, the second bounce was weaker, only managing to reach a high near $2,350. Now ETH has returned to the $1,750 level once again.
There are numerous bullish divergences in place in the MACD, RSI, and Stochastic oscillator. However, they are still unconfirmed. ETH has to rebound in order to confirm these signals.
The next closest support is at $1,500.
XRP
XRP has fallen below the $0.59 area and validated it as resistance. This level previously acted as support.
It has now returned to its June 22 levels close to $0.50 and is in the process of creating a double bottom pattern.
Similar to ETH, there are numerous bullish divergences in place. However, these are still unconfirmed. The XRP price has to bounce upwards in order to confirm these divergences.
DASH
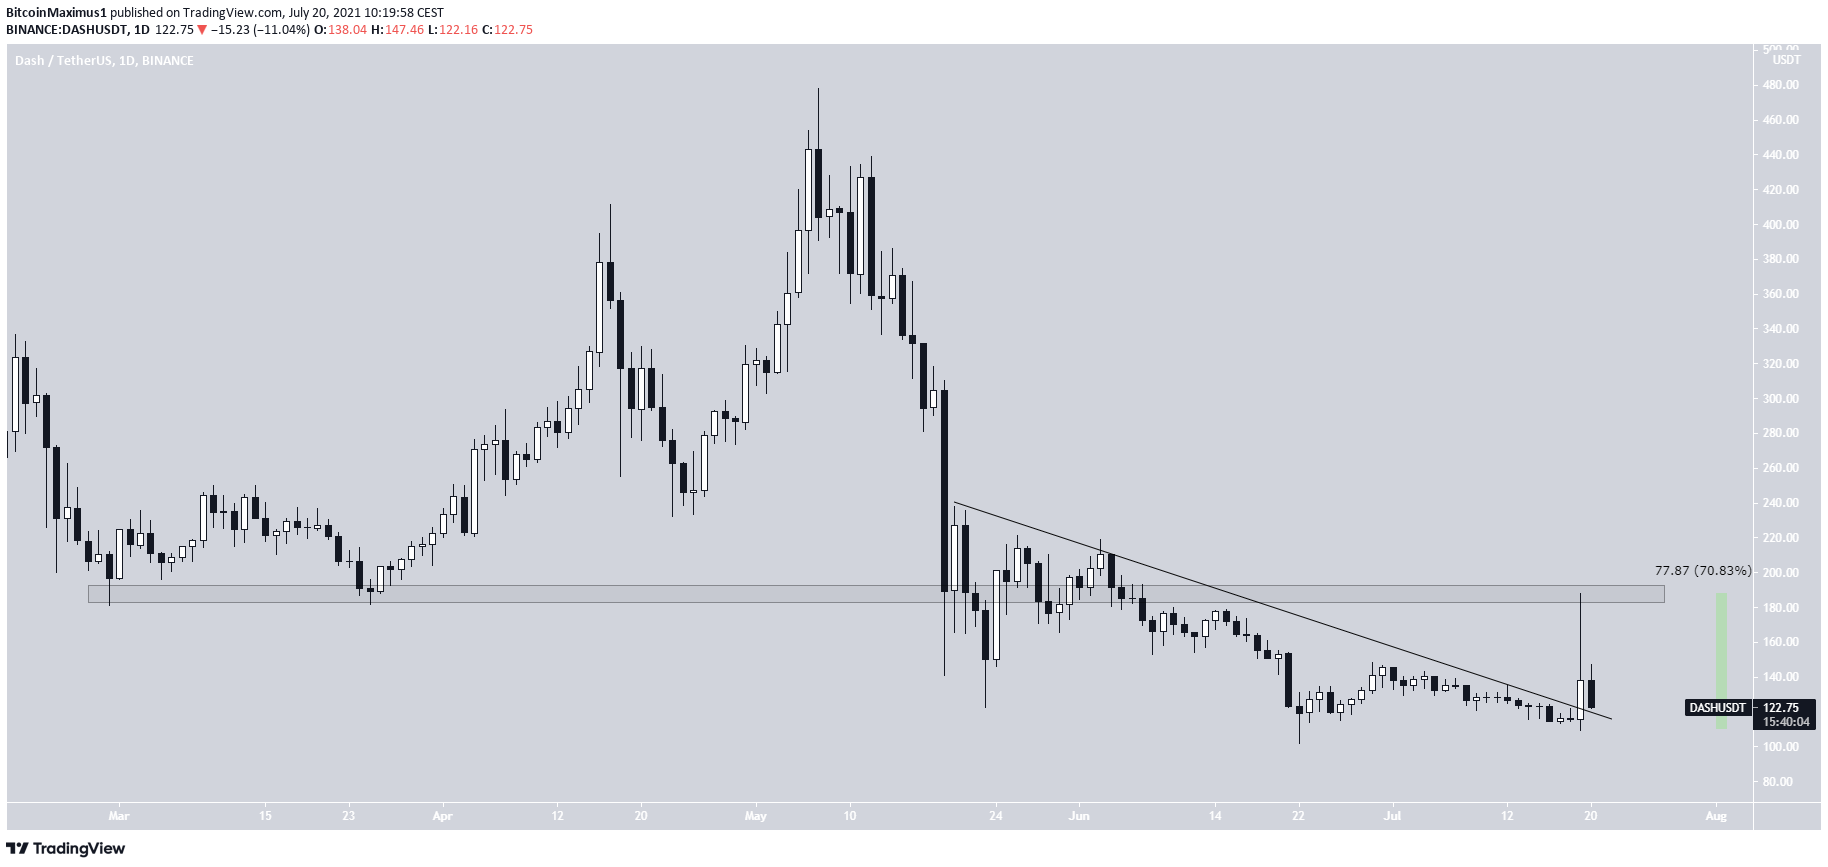
DASH had been decreasing alongside a descending resistance line since May 20.
On July 19, it initiated an upward move and broke out from the descending resistance line. At one point, DASH had increased by 71% inside the day.
However, it was rejected by the $190 resistance area and decreased immediately after, creating a long upper wick.
While DASH is still trading above the descending resistance line, it has to reclaim the $190 area in order for the trend to be considered bullish.
COMP
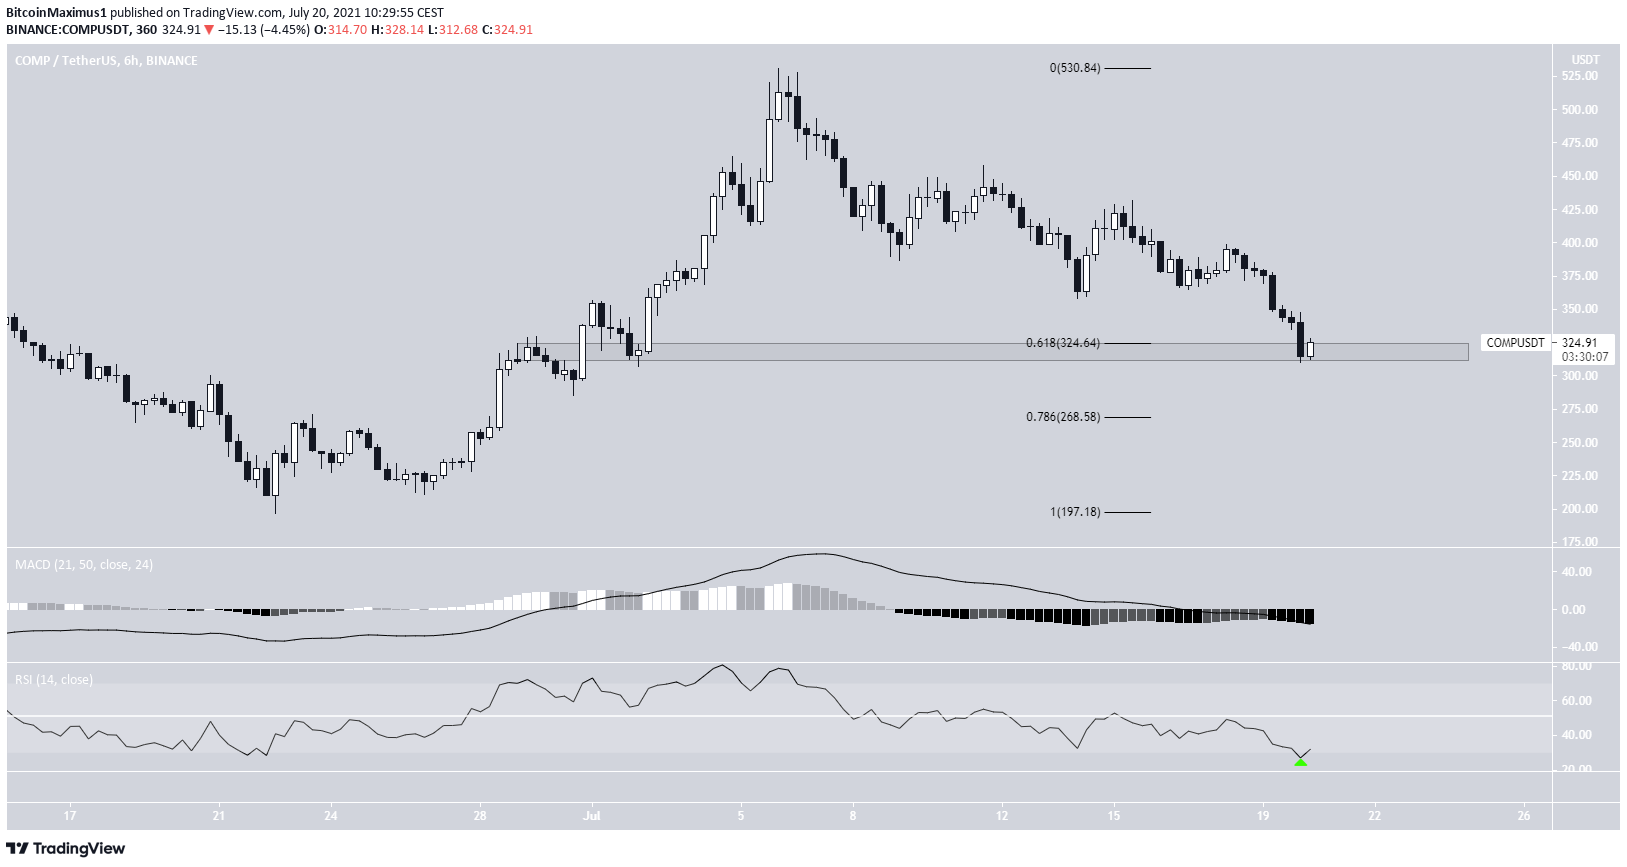
On June 22, COMP initiated an upward move after falling to a low of $196.46. This led to an eventual high of $530.98, reached on July 6.
However, COMP has been moving downwards since. It’s currently trading inside the $320 support area. This is both a horizontal and a Fib support level.
Technical indicators are bearish, since both the MACD and RSI are decreasing. However, the latter has just reached the oversold area.
ENJ
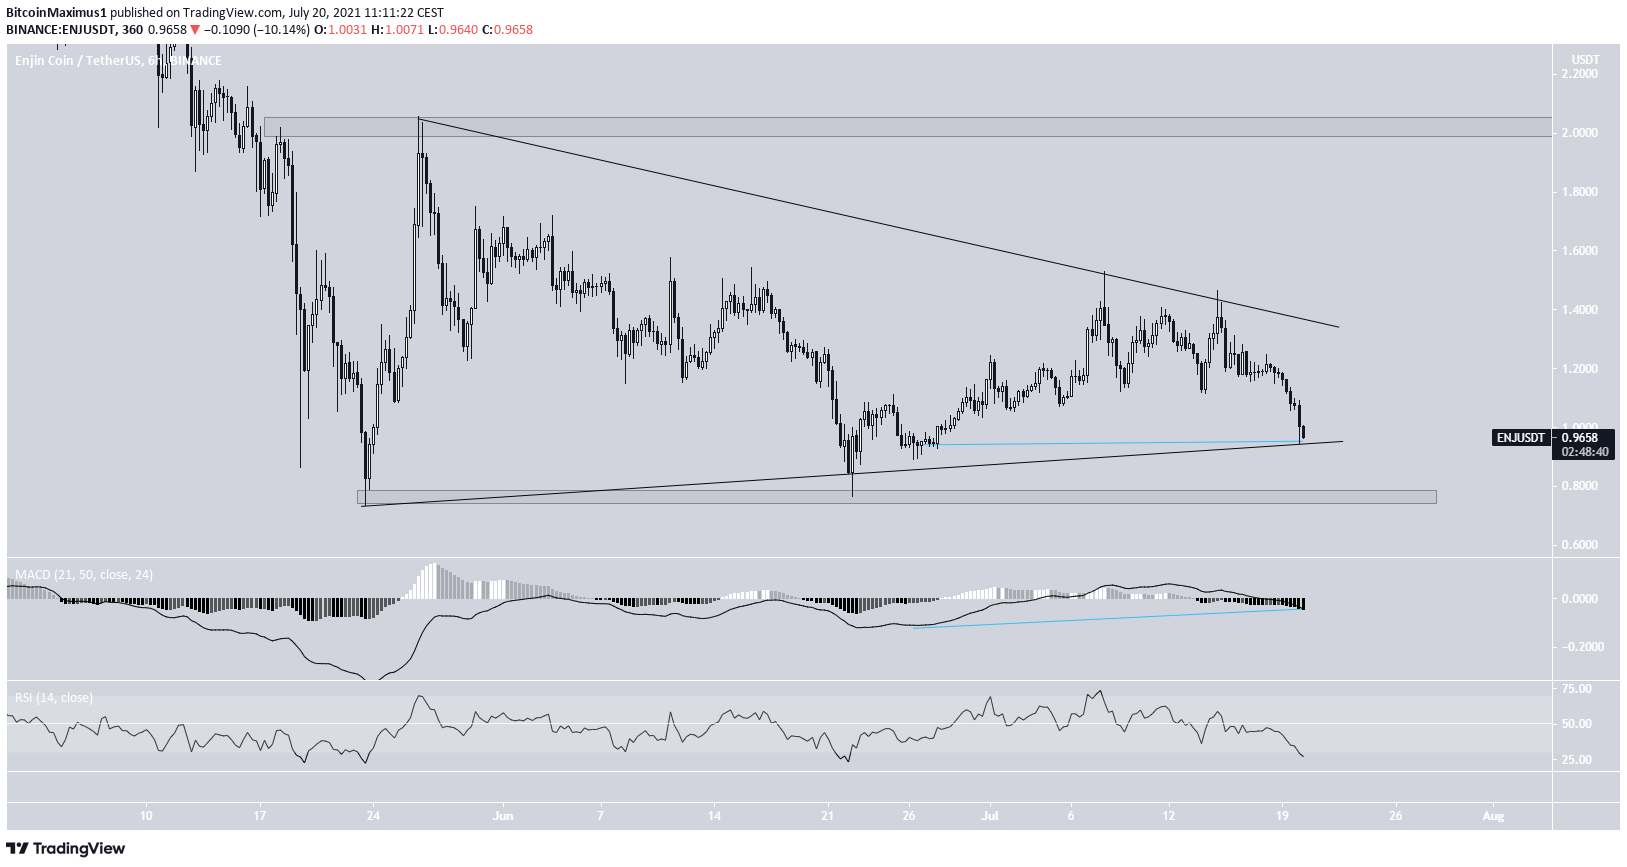
ENJ has been trading inside a symmetrical triangle since May 19. Both the support and resistance lines have been validated multiple times. At the time of press, ENJ was trading right at the support line of the triangle.
The symmetrical triangle is often considered a neutral pattern. In addition to this, technical indicators provide a relatively neutral reading. While the RSI is falling, it has just reached the oversold area.
Similarly, the MACD is falling but there is a potential bullish divergence in place.
Whether ENJ breaks out or falls from this pattern will likely determine the direction of the future trend.
The closest support and resistance levels are found at $0.76 and $2.05, respectively.
SOL
SOL has been following a descending resistance line since May 20. Throughout this time, it has bounced twice at the $24.50 horizontal support area.
While both bounces have created long lower wicks (green icons), it’s possible that the line and horizontal area have created a descending triangle, which is normally considered a bearish pattern.
SOL has just broken down below the $24.50 horizontal area, but has yet to reach a close below it. Therefore, it’s technically possible that the decrease will create a similarly long lower wick, as it did in May and June.
However, technical indicators are bearish. The next closest support is found at $13.