Origin Protocol (OGN) has been increasing since May 23 and has just broken out from a descending resistance line.
Both the short and medium-term outlook supports the possibility that the upward movement will continue towards the resistance area outlined below.
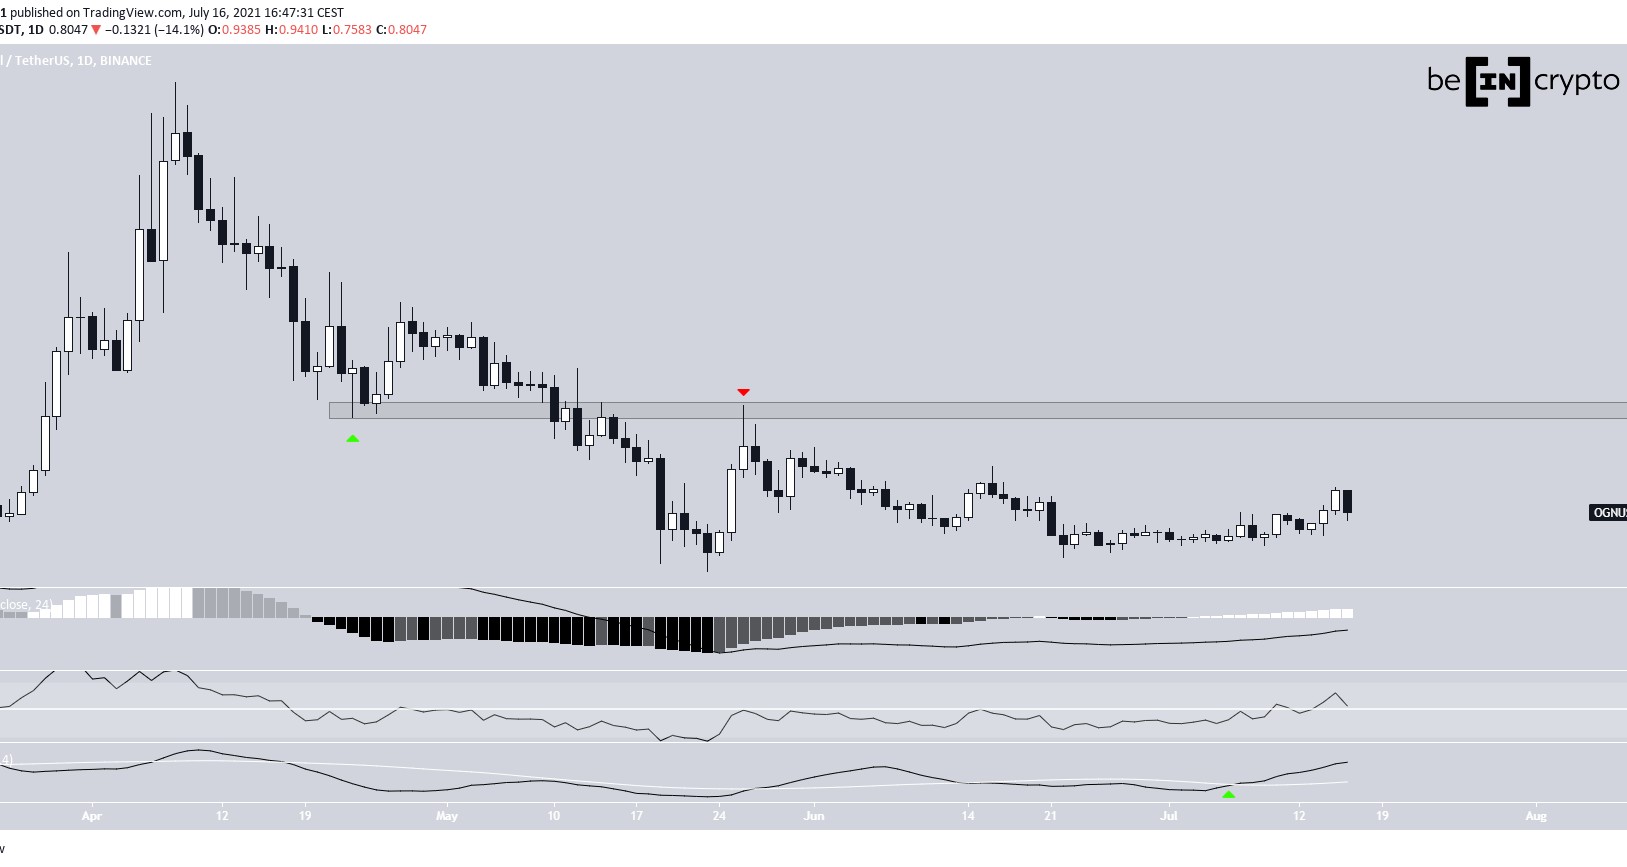
OGN bounces
OGN has been moving upwards since May 23, when it reached a low of $0.455. The initial bounce was very strong, leading to a high of $1.45 only three days later.
However, the token has been gradually moving downwards since.
Despite the drop, technical indicators are bullish. The MACD is moving upwards and is nearly positive. The RSI has already moved above the 50 line. The Stochastic oscillator has made a bullish cross.
The main resistance area is at $1.42.
Ongoing breakout
Cryptocurrency trader @TheEuroSniper outlined an OGN chart, stating that a reclaim of the current resistance line is required in order to confirm that the token is moving upwards.
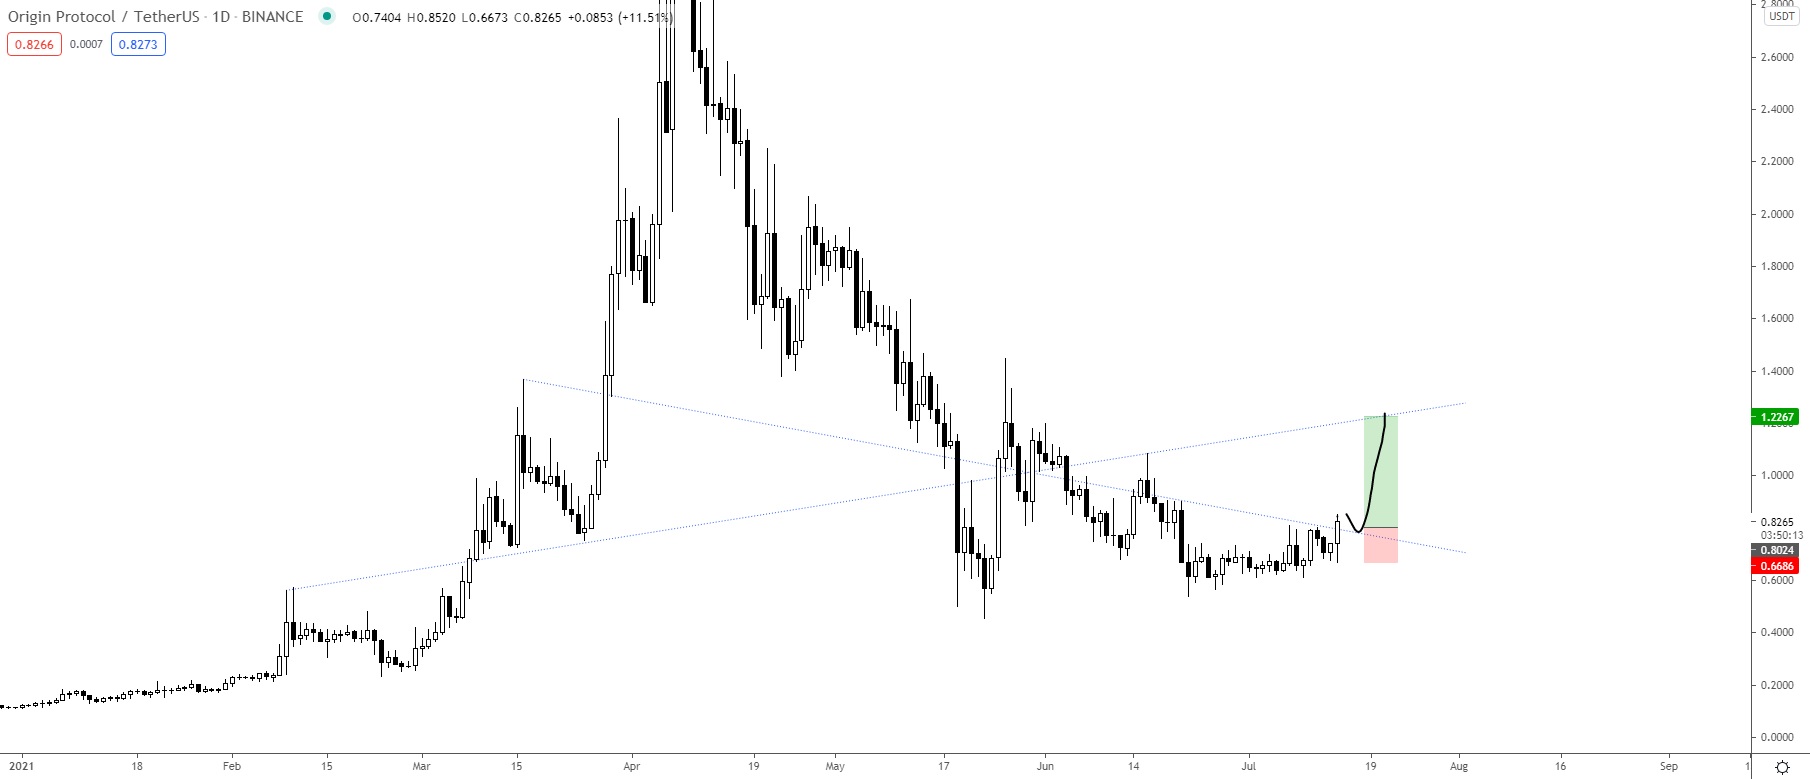
Since the tweet, OGN has broken out from the line and validated it as support afterwards (green icon), creating a higher low in the process.
So far, it has managed to reach a high of $0.957.
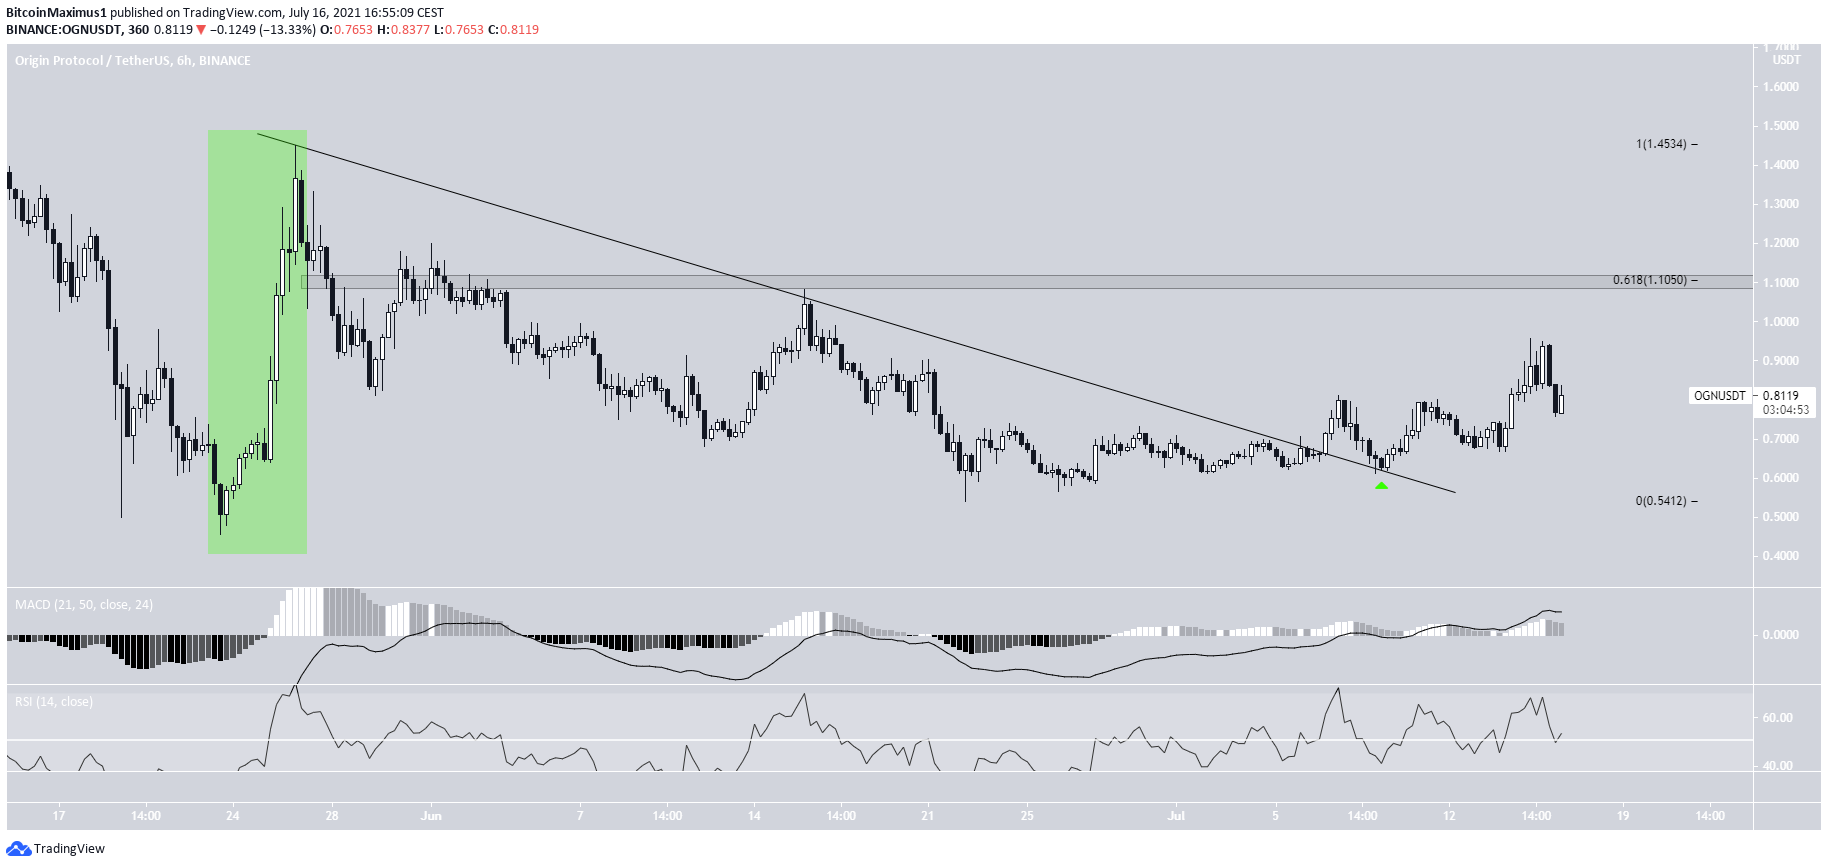
There is resistance at $1.10, both Fib and horizontal.
The MACD & RSI both support the continuation of the upward movement towards this area. Moving above it would likely take OGN towards the previously outlined $1.42 resistance area.
Finally, the upward movement resulting from the May 23 bounce looks impulsive (green), indicating that the ensuing decrease was corrective, and the token will head higher.
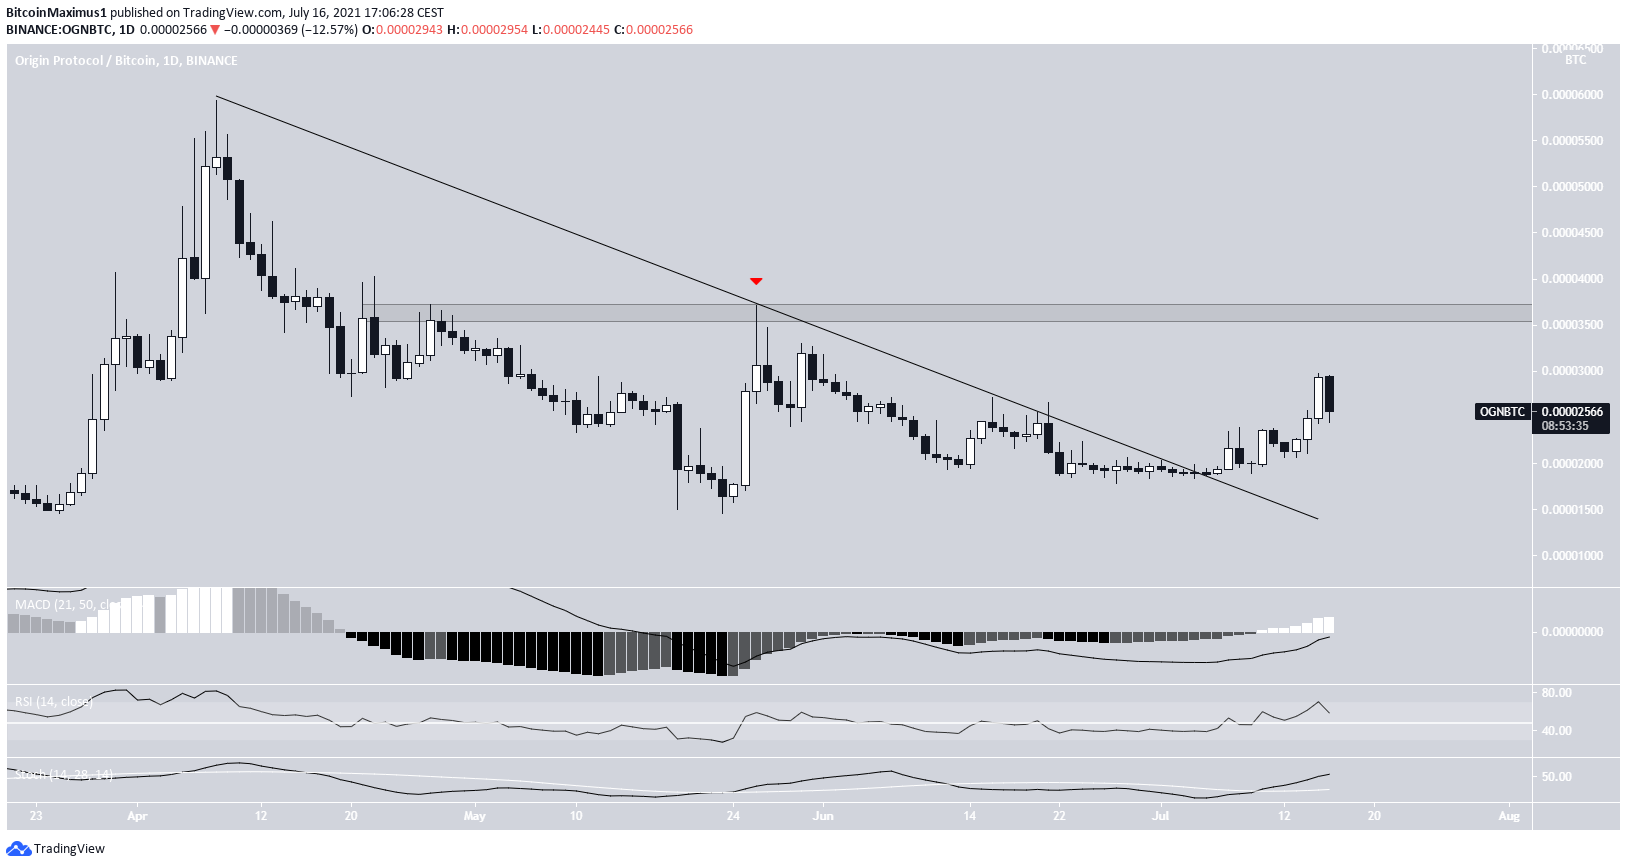
OGN/BTC
Similarly to the USD pair, OGN/BTC has also been moving upwards since May 23. After being rejected on May 26, it broke out from a descending resistance line on July 5. It has been moving upwards since.
Technical indicators support the continuation of the upward movement, providing nearly identical readings as those of the USD pair.
The main resistance area is at 3650 satoshis. While it seems that OGN will reach it, we cannot determine yet if it will break out once it does.