Waves.tech is a PoS-based blockchain algorithm that provides the necessary framework and platform for the creation of advanced and innovative decentralized applications. It provides user-friendly infrastructure, essential tools, and customized products and services to enhance app development. It also provides wallets for storing and managing your digital currency. WAVES is the main governance token of this ecosystem. Let us look at the technical analysis of WAVES.
Past Performance
On Jul 11, 2021, WAVES opened at $14.19. On Jul 16, 2021, WAVES closed at $13.42. Thus, in the past week, the WAVES price has decreased by roughly 5%. In the last 24 hours, WAVES has traded between $12.70 – $14.21.
https://s3.tradingview.com/snapshots/3/3GGf4yqp.png
Day-Ahead and Tomorrow
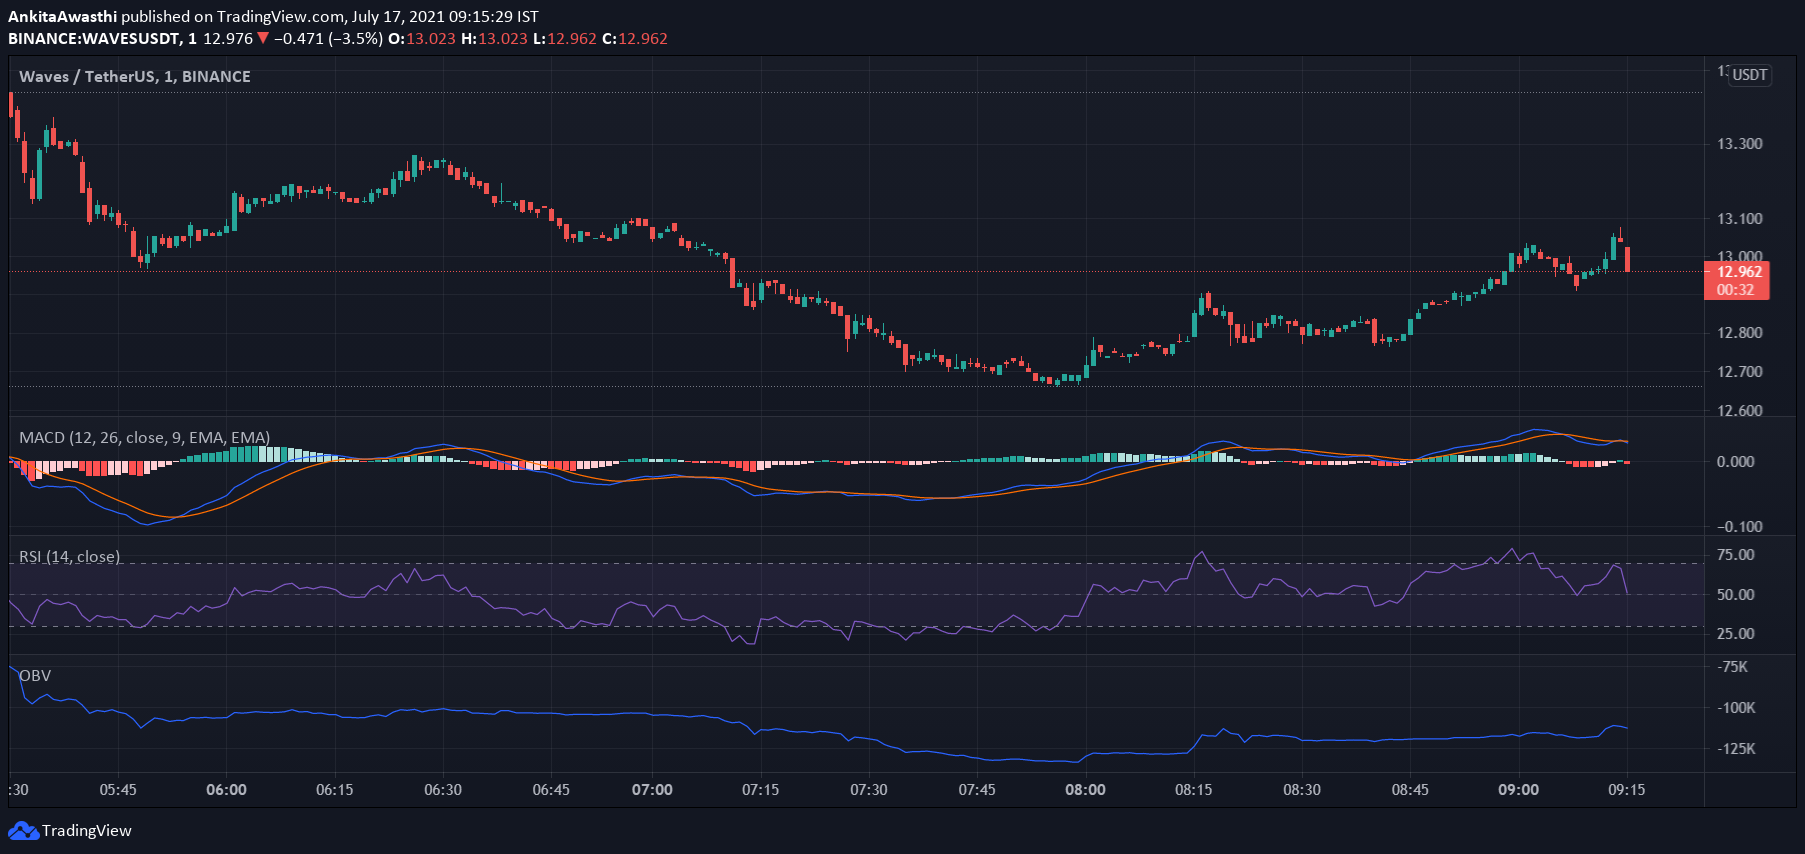
Currently, WAVES is trading at $12.96. The price has decreased from the day’s opening price of $13.42. Thus, the market seems bearish.
The MACD and signal lines are positive. Moreover, a bullish crossover by the MACD line over the signal line has occurred. Thus, the overall market momentum is bullish. Hence, we can expect the price to start increasing.
Currently, the RSI indicator is at 59%. It faced rejection at 65% and fell to the current level. Hence, selling pressures are high. High selling activity is likely to exert downward pressure on the WAVES price.
However, the OBV indicator has started falling steadily. Thus, selling volumes are slowly overtaking buying volumes. Hence, the price may fall further.
In short, the MACD oscillator has given positive signals while the OBV and RSI indicators have given negative signals. Hence, the overall market momentum seems bearish. But, we have to wait and watch if a bearish trend reversal occurs in some time.
WAVES Technical Analysis
Currently, the price is below the Fibonacci pivot point of $13.44. The price may soon fall below the first Fibonacci pivot support level of $12.86 as well. Thereafter, we have to wait and watch if the price starts rising or falls further.
Currently, the price has fallen below the 23.6% FIB retracement level of $13.06. It may soon fall below the 23.6% FIB extension level of $12.34. By day close, if the price retests and breaks out of these levels, then an uptrend has probably set in. In that case, the price may continue rising tomorrow as well.