September was a relatively bearish month for the cryptocurrency market. Bitcoin (BTC) decreased by 8%, and only three tokens posted triple digit rates of increase. This was in stark contrast with August, when more than ten tokens posted triple digit rates of increase.
The ten altcoins that increased the most during September were:
- Celer Network (CELR) : 196%
- Coti (COTI) : 101%
- DigitalBits (XDB) : 100%
- OMG Network (OMG) : 89%
- Cosmos (ATOM) : 49%
- Algorand (ALGO) : 43%
- Hedera Hashgraph (HBAR) : 27%
- Solana (SOL) : 26%
- Near Protocol (NEAR) : 25%
- IOST (IOST) : 22%
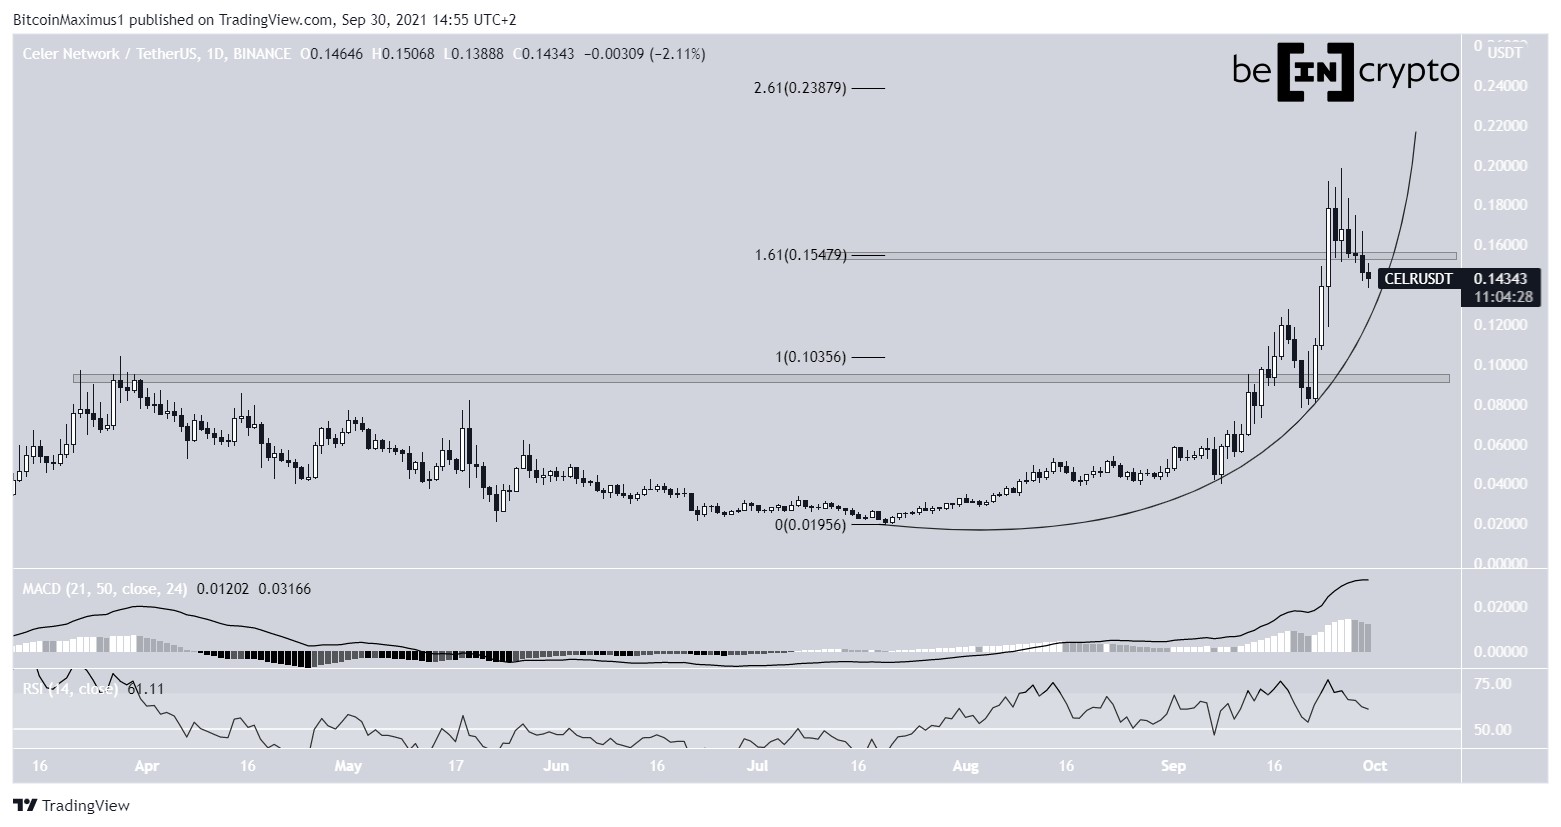
CELR has been increasing alongside a parabolic ascending support line since July 20. This led to a new all-time high price of $0.198 on Sept 16.
The high was made above the 1.61 external Fib retracement resistance level of $0.155 but below the 2.61 resistance at $0.24.
While CELR has been dropping since, it is still trading above the parabolic support line. Furthermore, technical indicators have not yet turned bearish.
If CELR manages to reclaim the $0.155 area, it would likely head towards $0.24.
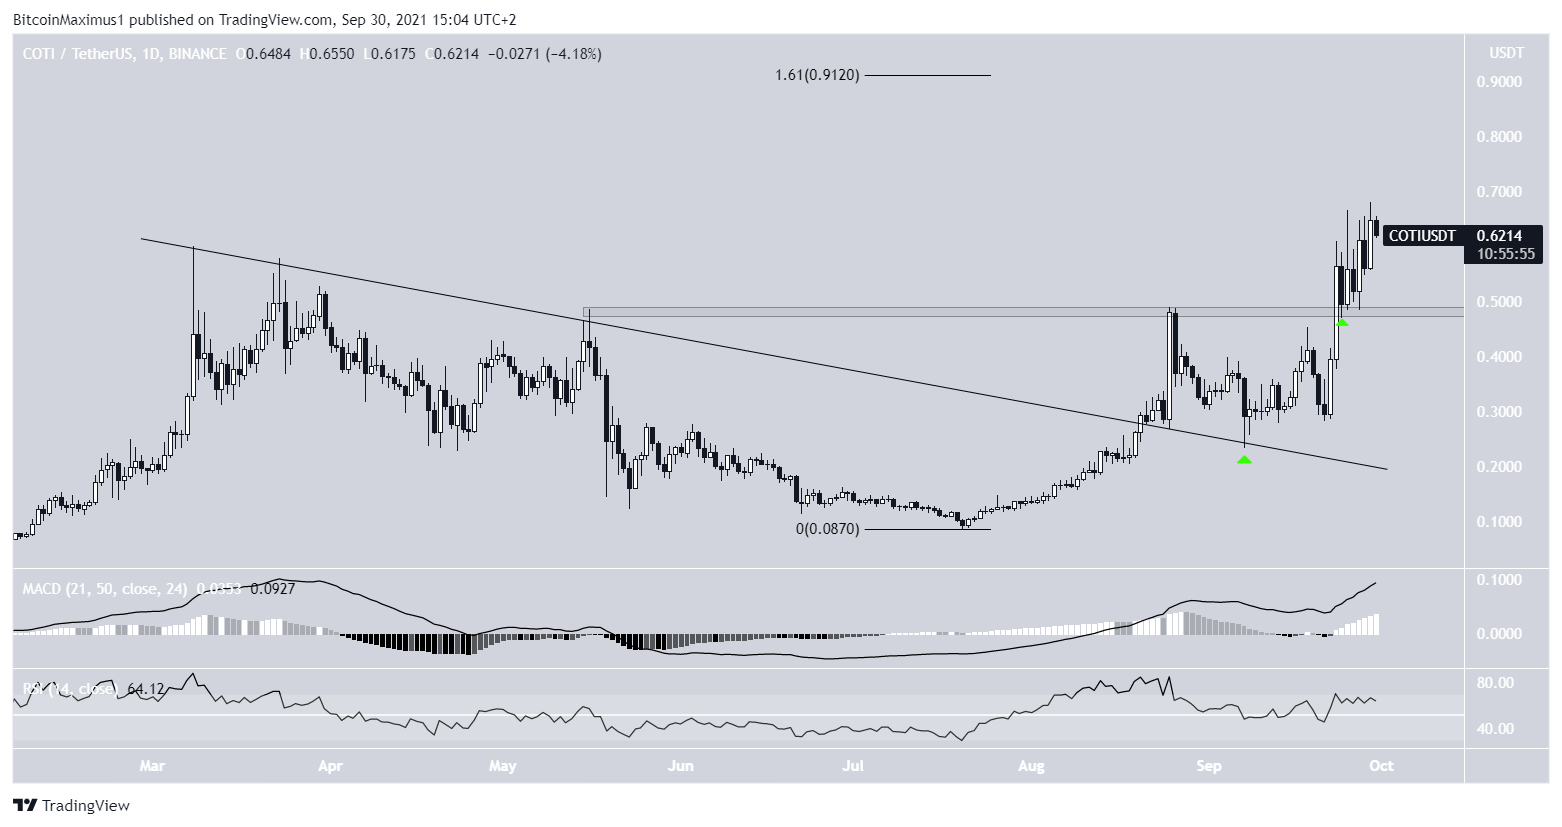
COTI
COTI has been moving upwards since breaking out from a parabolic ascending support line and validating it as support afterwards on Sept 7 (green icon).
On Sept 23, it broke out from the $0.48 resistance area and validated it as support. The upward movement continued and led to a new all-time high price of $0.68 on Sept 29.
The MACD and RSI are both moving upwards.
If COTI continues to increase, the next resistance would be at $0.91. This is the 1.61 external Fib retracement resistance level.
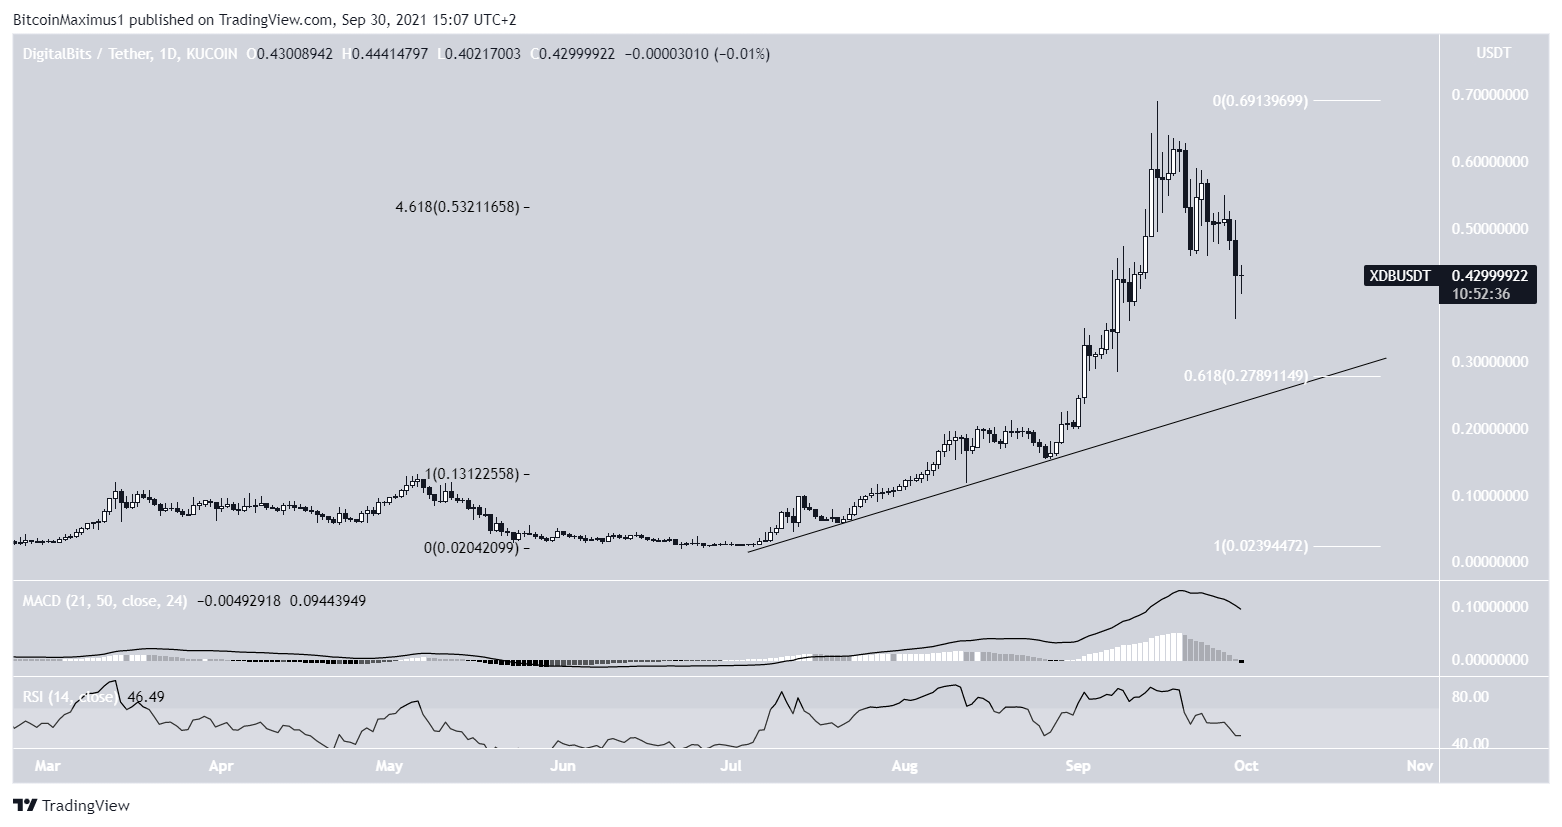
XDB
XDB has been moving upwards since the beginning of July. On Sept 15, it reached an all-time high price of $0.69. The high was made just above the 4.618 external Fib retracement level when measuring the most recent portion of the drop. The level often acts as the top for bullish impulses.
Technical indicators are gradually turning bearish, since both the RSI and MACD are falling, the former having just fallen below 50.
If XDB continues falling, the closest support would be at $0.28. This is the 0.618 Fib retracement support level and coincides with an ascending support line in place since the July lows.
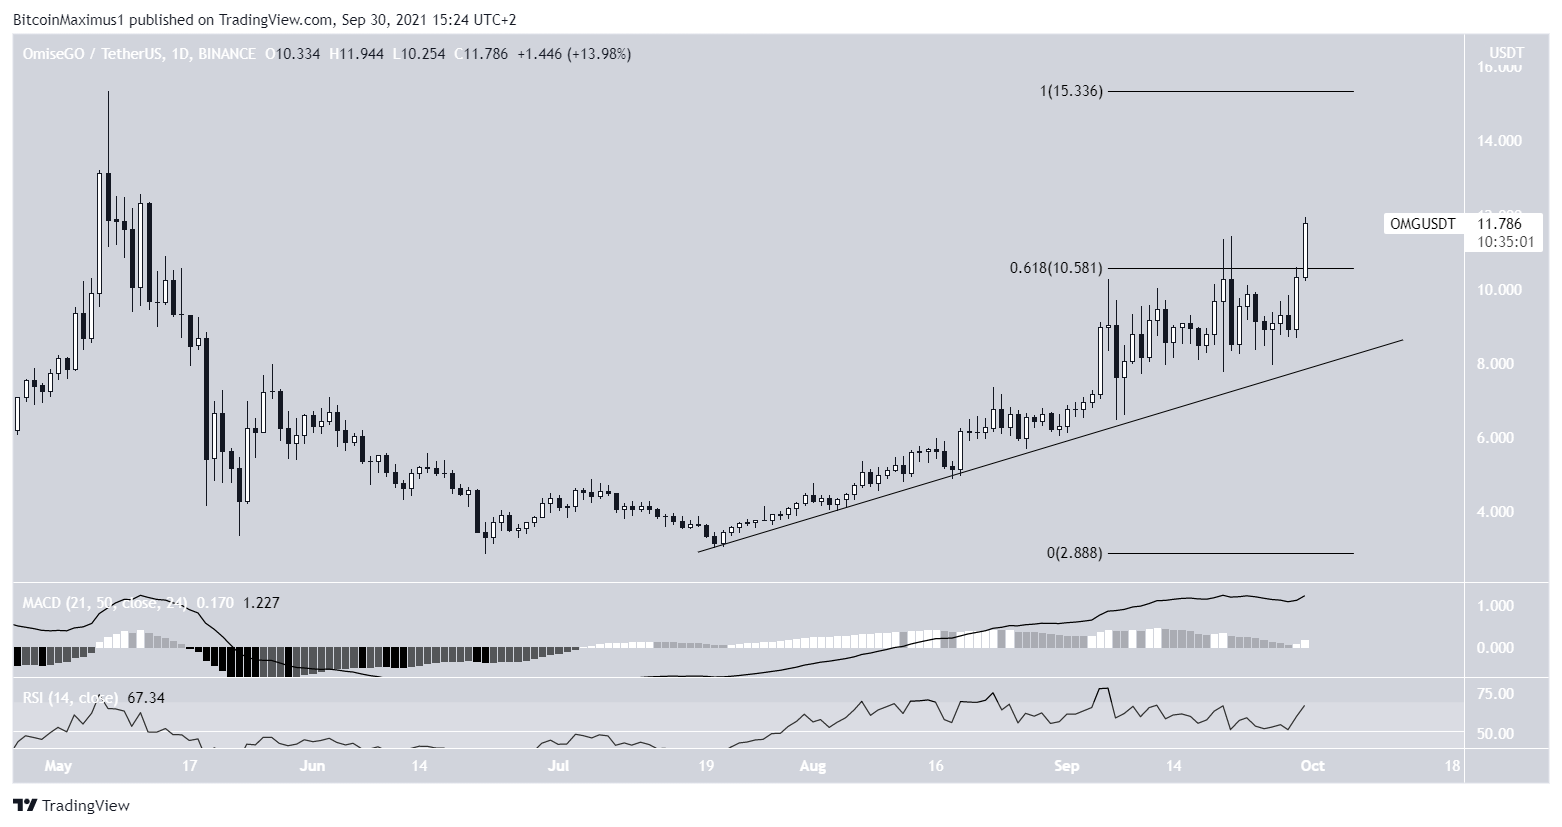
OMG
OMG has been increasing alongside an ascending support line since July 20. On Sept 6, it reached a high of $10.30 but failed to break out above the 0.618 Fib retracement resistance level at $10.60.
After making several unsuccessful attempts, it finally broke out on Sept 30. The breakout is supported by both the RSI and MACD, which are increasing.
The next resistance area is at $15.33.
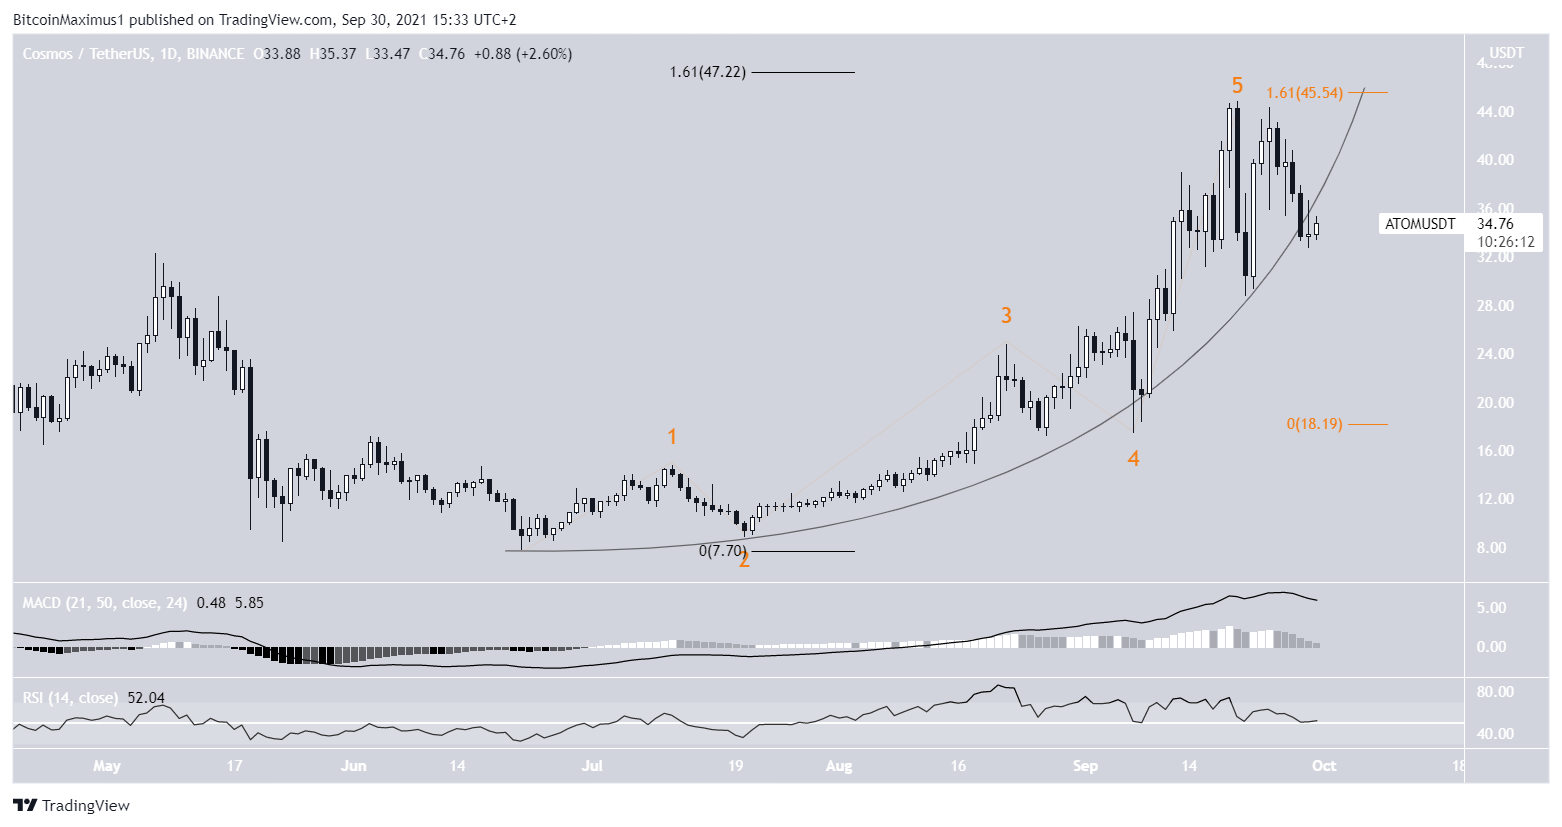
ATOM
ATOM has been increasing alongside a parabolic ascending support line since the June 21. The upward movement led to a new all-time high of $44.80 on Sept 20.
The high was made at the 1.61 external Fib retracement level (black) and the 1.61 length of waves 1-3 (orange). This is a likely level for the upward movement to be concluded in.
Furthermore, ATOM seems to be in the process of breaking down from the parabolic ascending support line, which would confirm that the upward movement has ended.
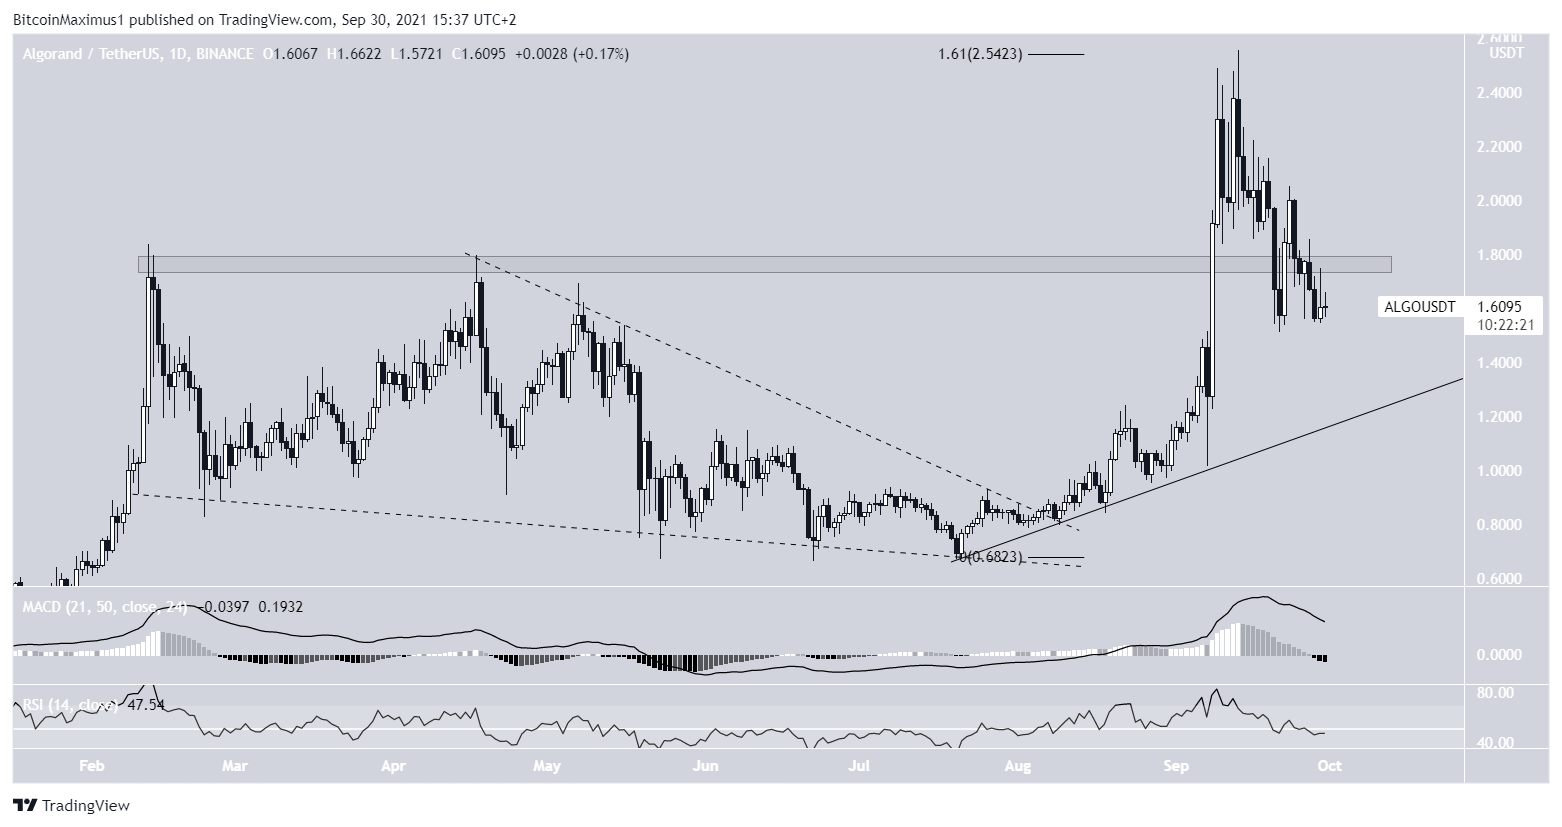
ALGO
ALGO has been increasing since breaking out from a descending wedge on Aug 8. The upward movement has followed an ascending support line.
On Sept 13, ALGO reached an all-time high of $2.55. The high was made just above the 1.61 external Fib retracement resistance level. Since then, the token has been moving downwards and has broken down below the $1.80 horizontal area.
The closest support area is at $1.30, coinciding with the ascending support line.
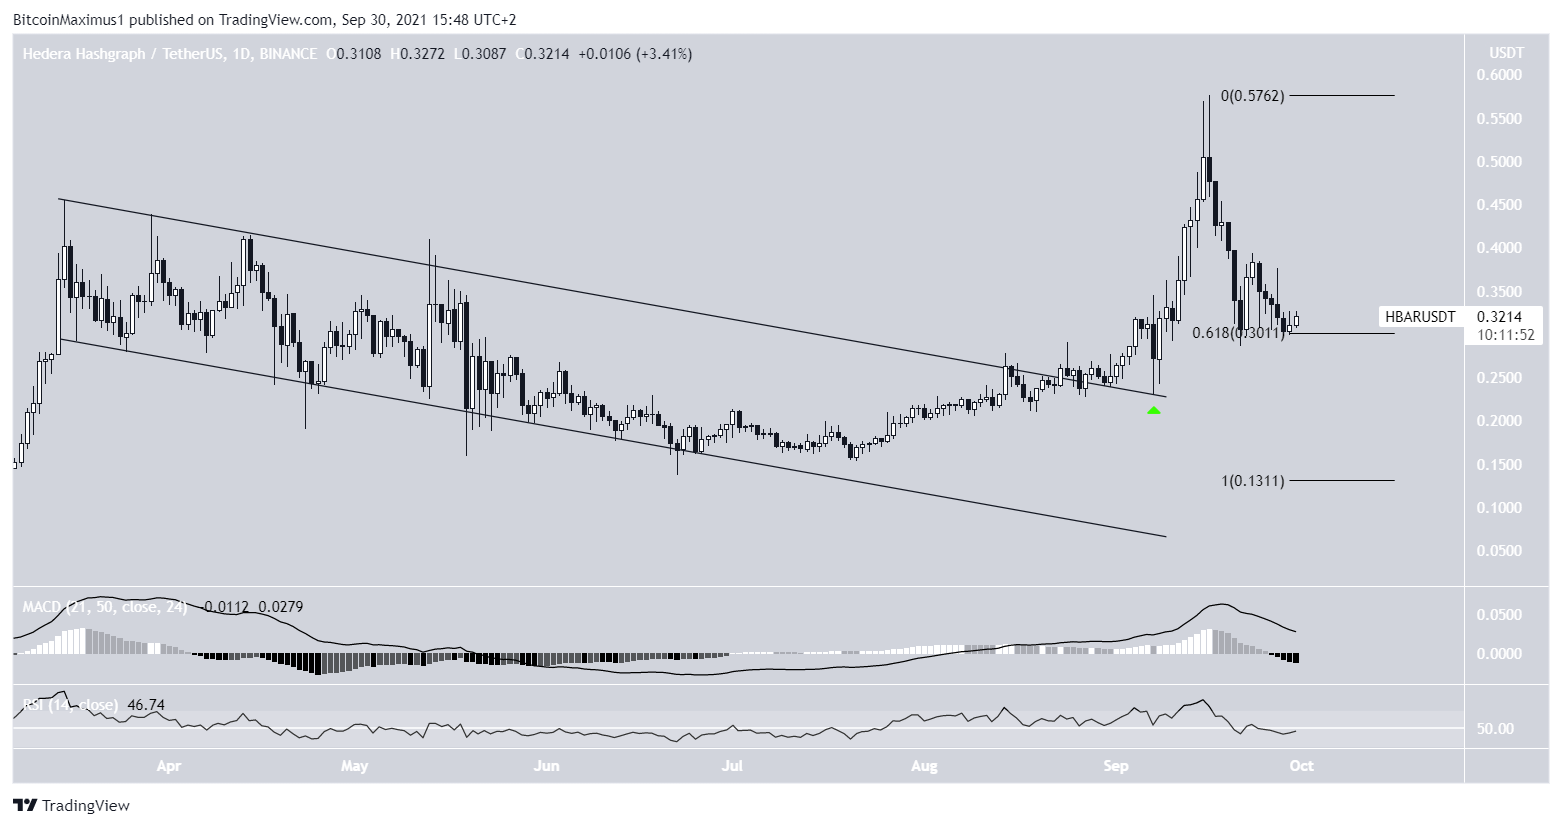
HBAR
HBAR has been increasing since breaking out from a descending parallel channel and validating it as support on Sept 7 (green icon). This led to a new all-time high price of $0.574 on Sept 16.
HBAR has been moving downwards since, in a decrease that is also supported by the falling MACD.
It has currently bounced at the 0.618 Fib retracement support level at $0.30, and is potentially beginning a short-term upward movement.
However, it is possible that the longer-term trend has turned bearish.
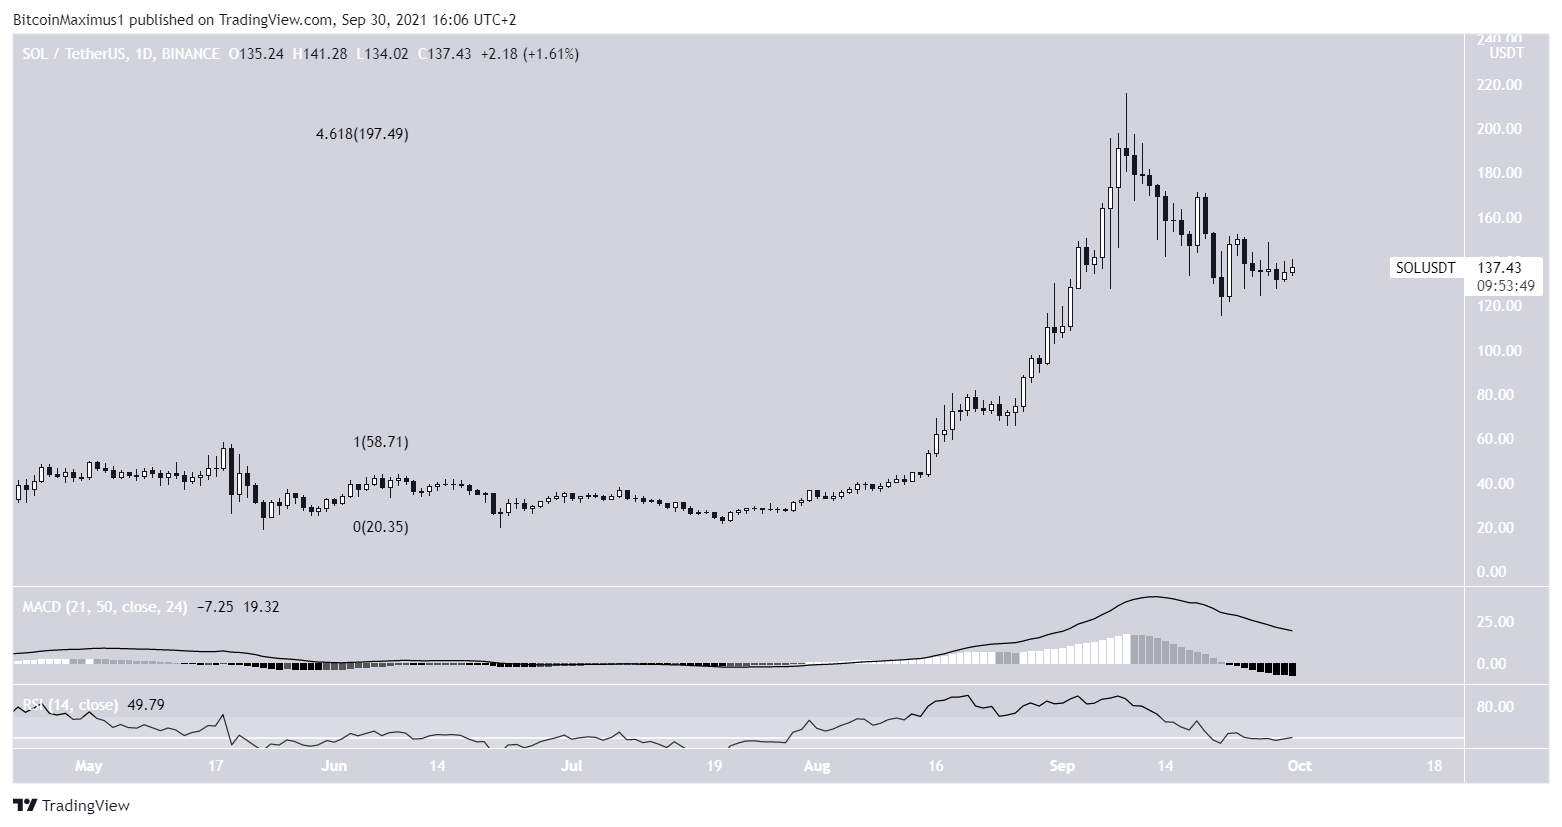
SOL
SOL has been moving upwards since June 2. The upward movement accelerated in July and the token reached a new all-time high price of $216 on Sept 9.
Similarly to XDB, the high was made very close to the 4.61 external Fib retracement level, which often acts as the top for upward movements.
Therefore, it is possible that the upward movement for SOL has concluded.
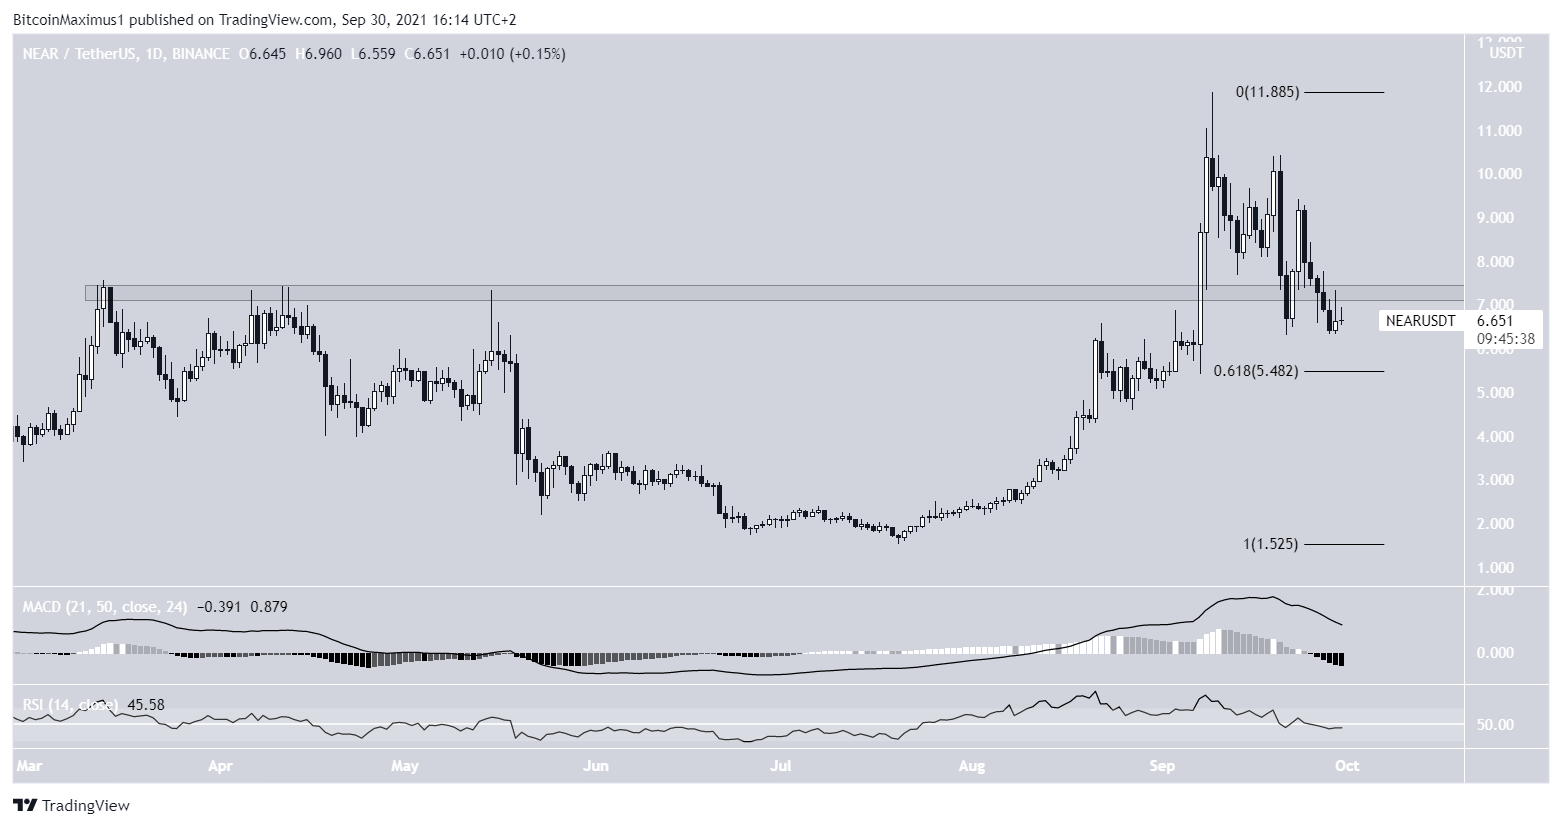
NEAR
NEAR has been increasing since July 21. On Sept 7, it broke out from the $7.40 resistance area and proceeded to reach an all-time high of $11.88 on Sept 9.
However, the token has been moving downwards since and has fallen below the $7.40 area, which was expected to act as support.
The next closest support area is at $5.50. This is both the 0.618 Fib retracement support level and a horizontal support area.
Both the RSI and MACD are moving downwards, supporting the continuation of the downward movement.
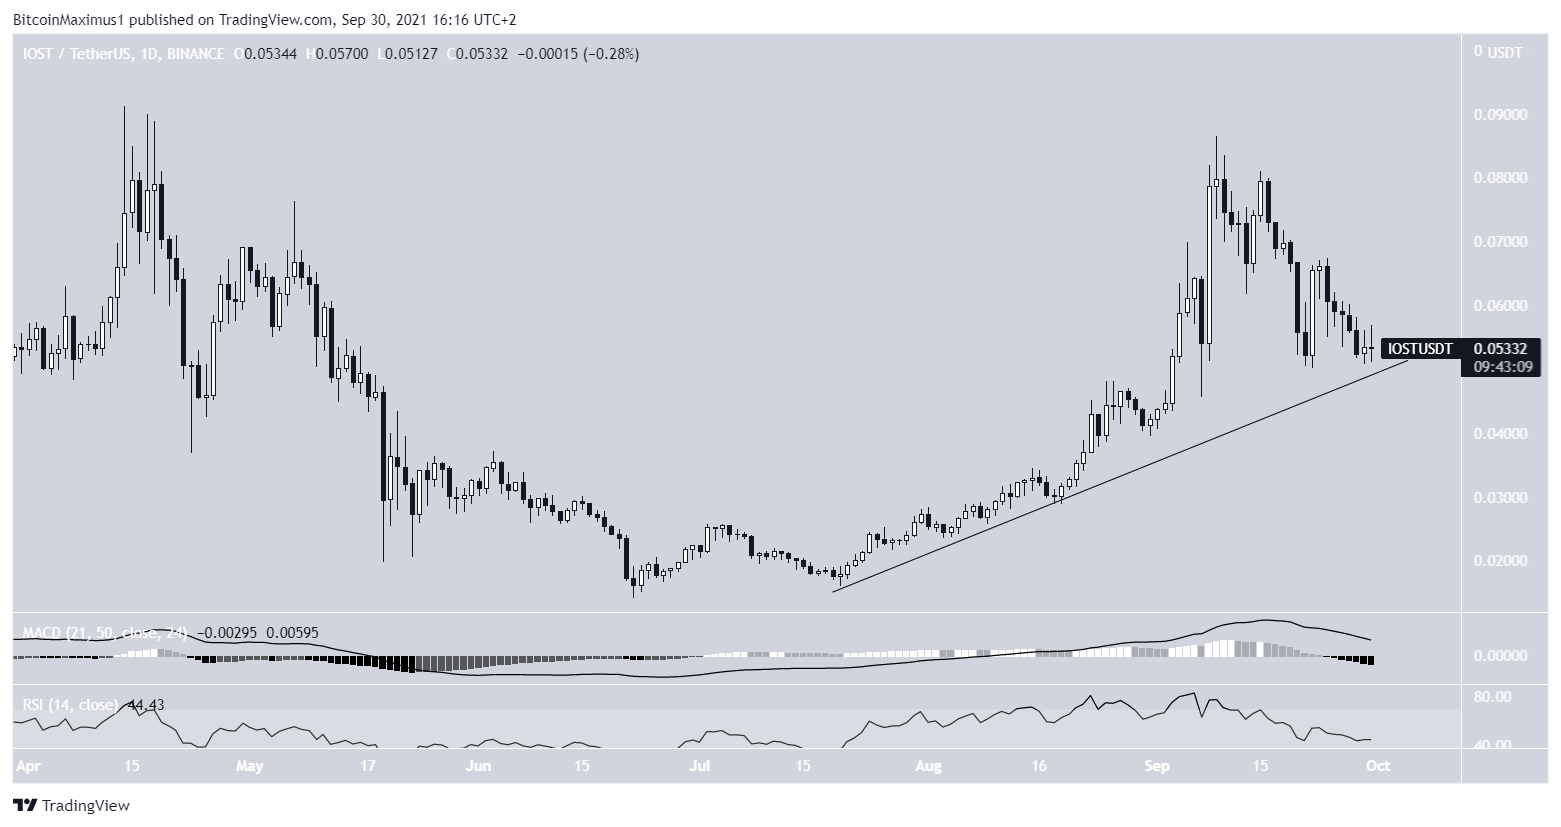
IOST
IOST has been increasing alongside an ascending support line since July 20. This led to a high of $0.087 on Sept 9.
The token has been decreasing since, in a downward movement that is supported by the falling MACD and RSI.
However, it has reached the ascending support line once more. As long as the support line is in place, the bullish structure remains intact.