BeInCrypto breaks down the five biggest altcoin movers and shakers from the previous week. Will their momentum continue?
The five altcoins that increased the most last week were:
- Axie Infinity (AXS): 115.83%
- Telcoin (TEL): 56.31%
- THETA (THETA): 37.38%
- Internet Computer (ICP): 31.50%
- OKB (OKB): 29.26%
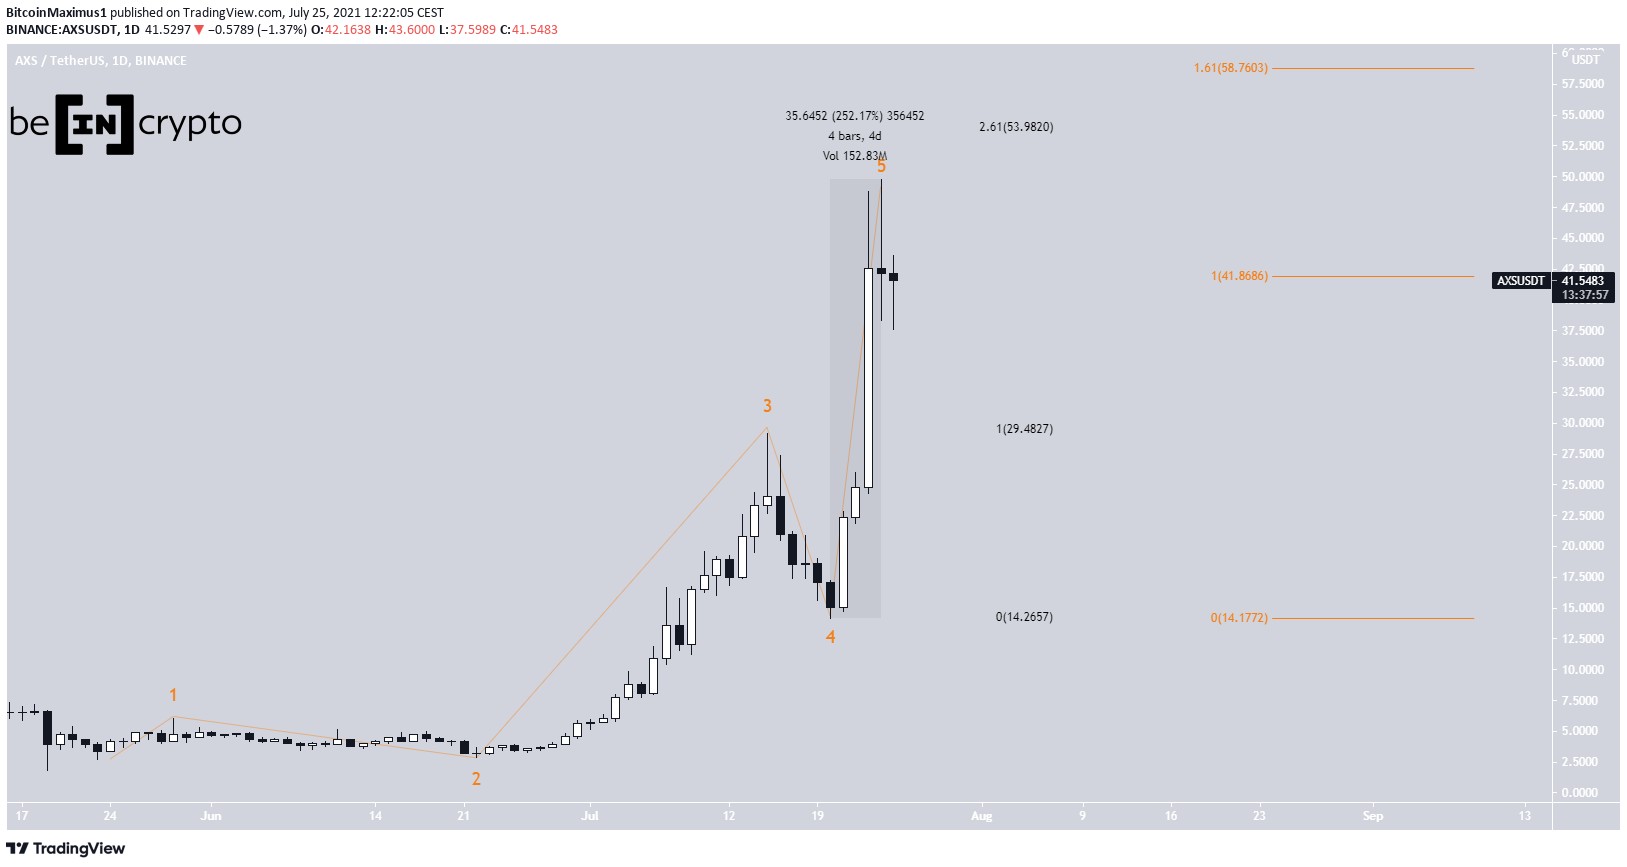
AXS
AXS has been increasing since it reached a low of $14.10 on July 20. It proceeded to reach an all-time high of $49.78 on July 24.
In a span of four days, AXS managed to increase by 252%. However, the higher prices could not be sustained and it created a long upper wick.
It’s possible that a high has already been reached. AXS has moved above the $41.86 resistance area but failed to sustain the upward move. $41.86 is a likely level for a top as it’s the Fib extension level of waves 1-3 (orange).
If another upward move transpires, the next most likely resistance area would be found between $54-$58.76. This range is created by an external Fib retracement (black) and a Fib projection (orange).
In any case, it seems that AXS is in wave five of a bullish impulse, therefore it’s likely to reach its top soon.
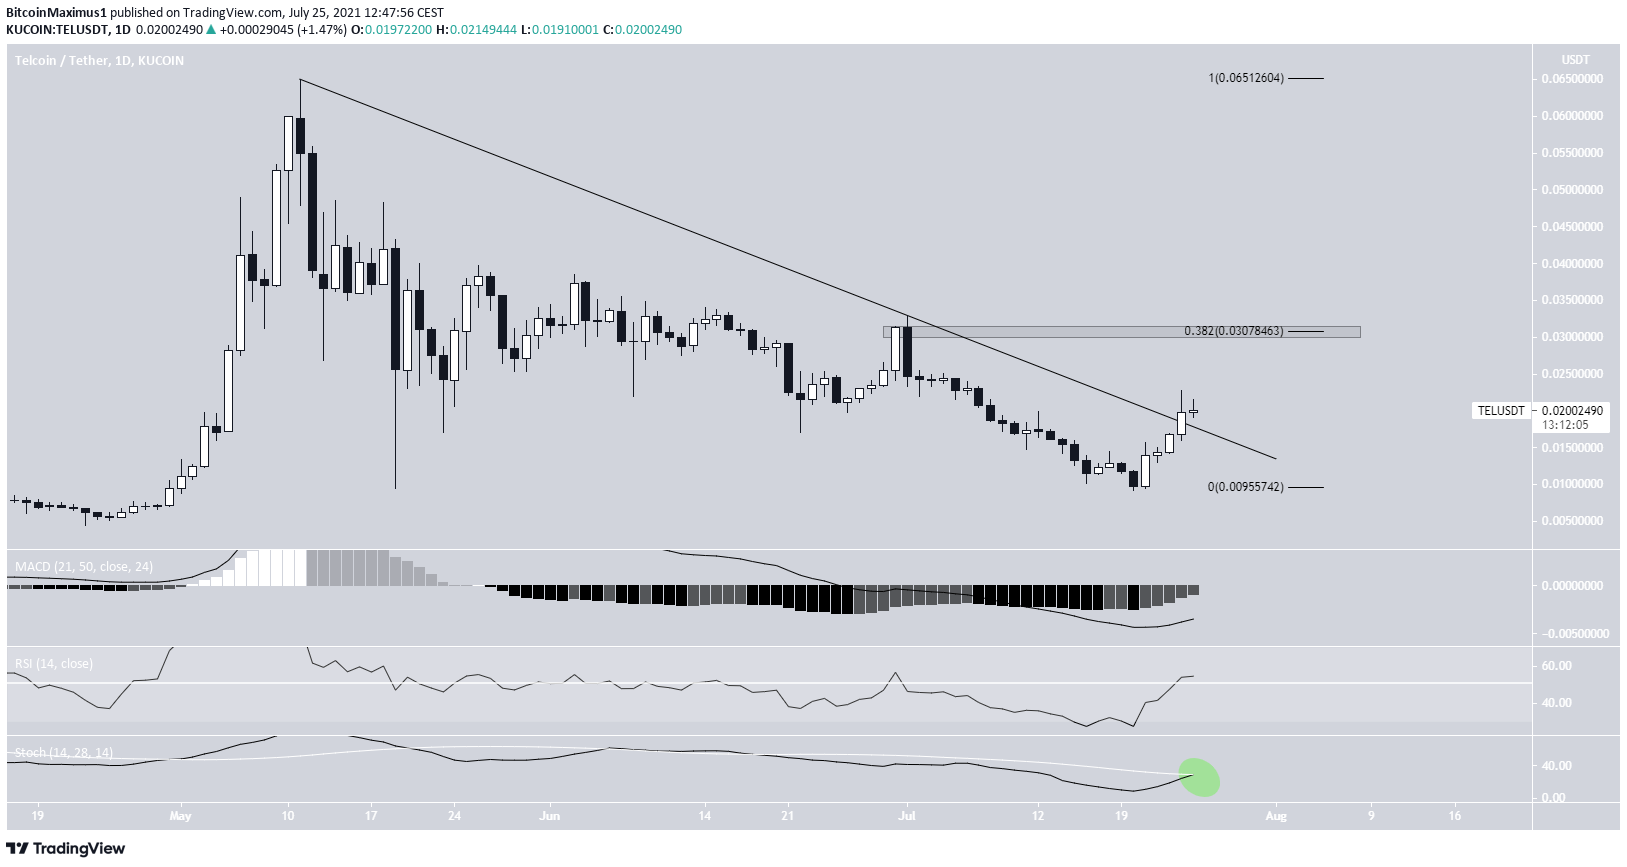
TEL
TEL has been decreasing alongside a descending resistance line since May 11 after it reached an all-time high price of $0.064. It made an unsuccessful breakout attempt on July 1 (red icon).
On July 20, TEL reached a low of $0.0091. Relative to the price on May 19, this created a double bottom pattern.
TEL broke out from the descending resistance line shortly afterwards.
Technical indicators are relatively bullish. The RSI has just crossed above 50 and the Stochastic oscillator just made a bullish cross.
The closest resistance area is found at $0.03. This is the 0.382 Fib retracement resistance level.
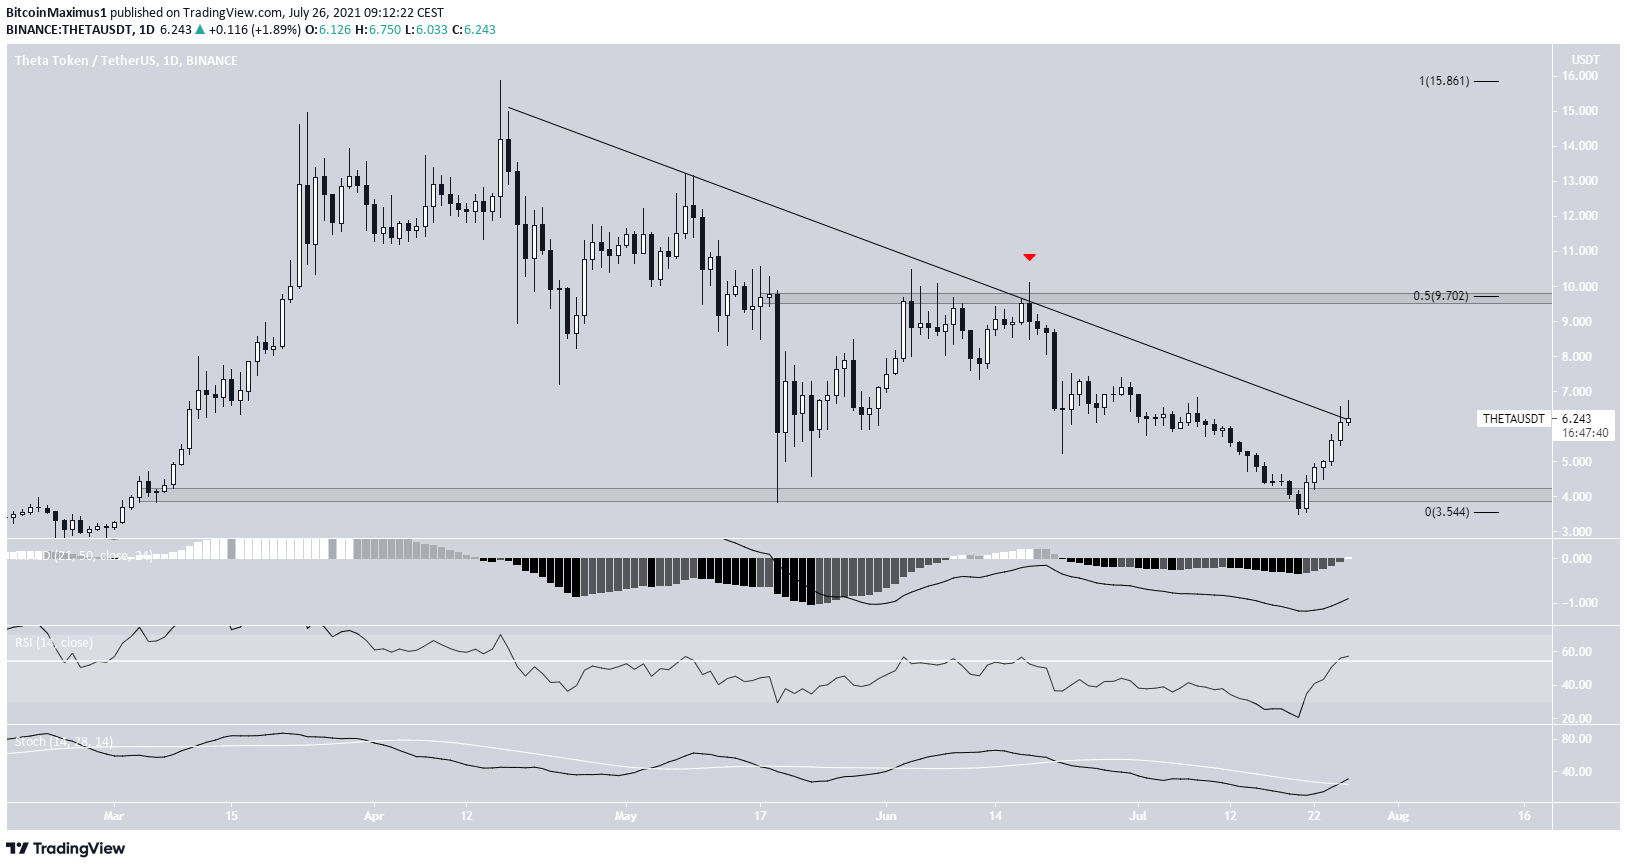
THETA
THETA has been decreasing alongside a descending resistance line since April 16, when it reached an all-time high price of $15.88.
So far, it has made three unsuccessful breakout attempts, most recently on June 17 (red icon).
On May 19 and July 20, THETA made a double bottom pattern near the $4 horizontal support area.
It’s been moving upwards since the double bottom and is currently attempting to break out once again. The MACD, RSI, and Stochastic oscillator are all increasing, supporting the possibility of a breakout.
If it breaks above descending line, the next closest resistance area would likely be found at $9.70. This is the 0.5 Fib retracement resistance level and a horizontal resistance area.
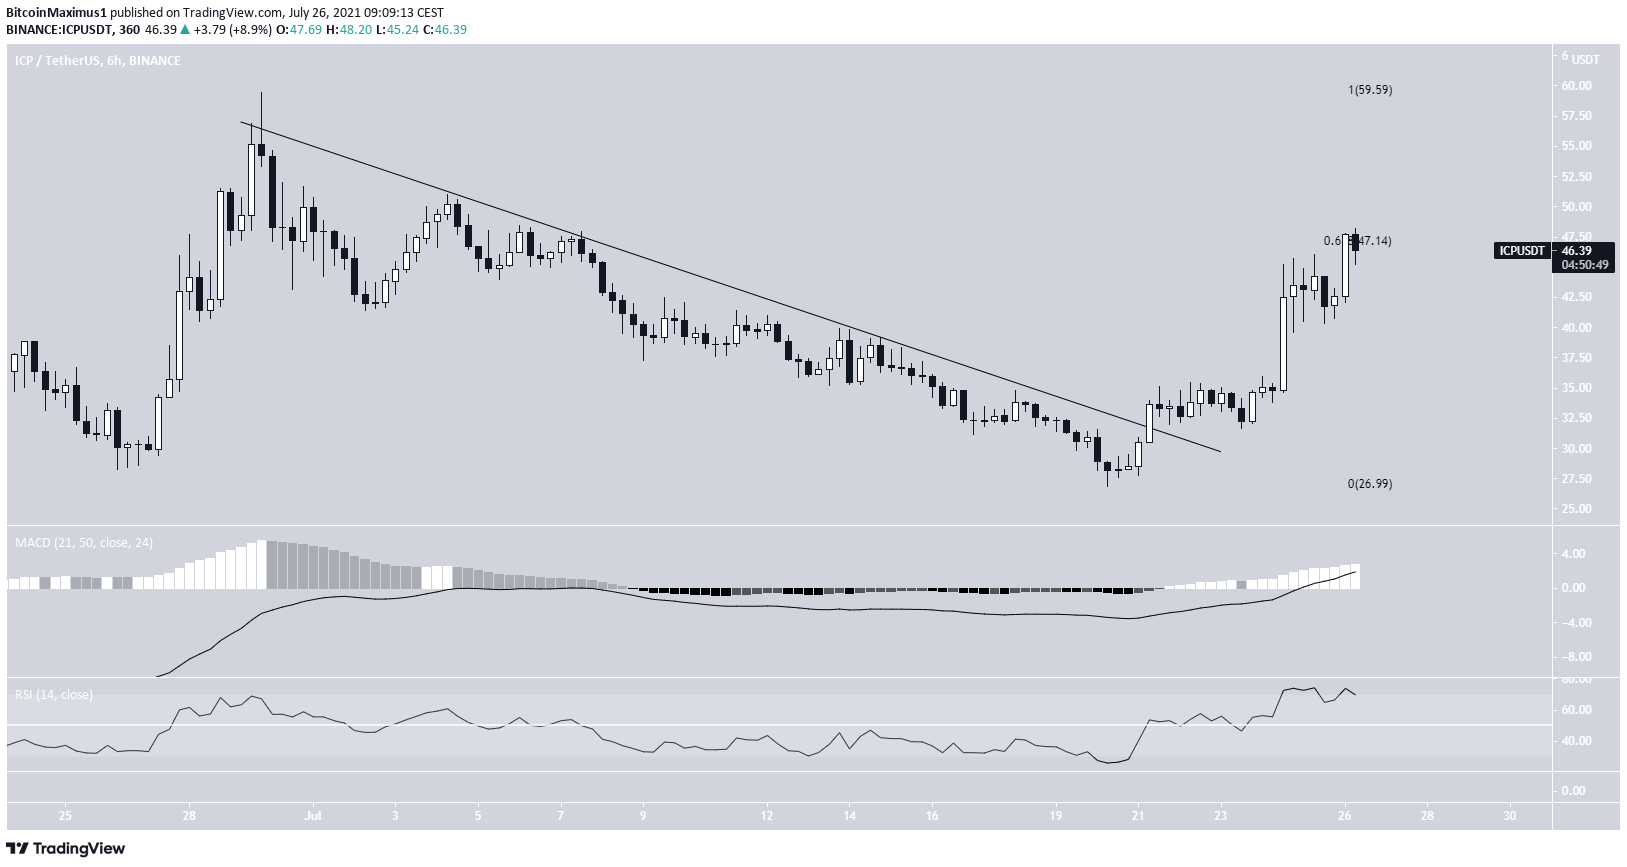
ICP
ICP has been decreasing alongside a descending resistance line since June 29. On June 26 and July 20, ICP created a double bottom pattern close to $27.
After this, it began an upward move and broke out from the descending resistance line.
The double bottom and breakout look identical to that of TEL, with the only exception being that the movement of ICP is transpiring inside a much shorter time frame.
Currently, ICP is trading at the 0.618 Fib retracement resistance level at $47. A breakout above here would likely initiate an upward move toward the $60 area.
The MACD is positive and increasing while the RSI has crossed above 70. These are both bullish signs.
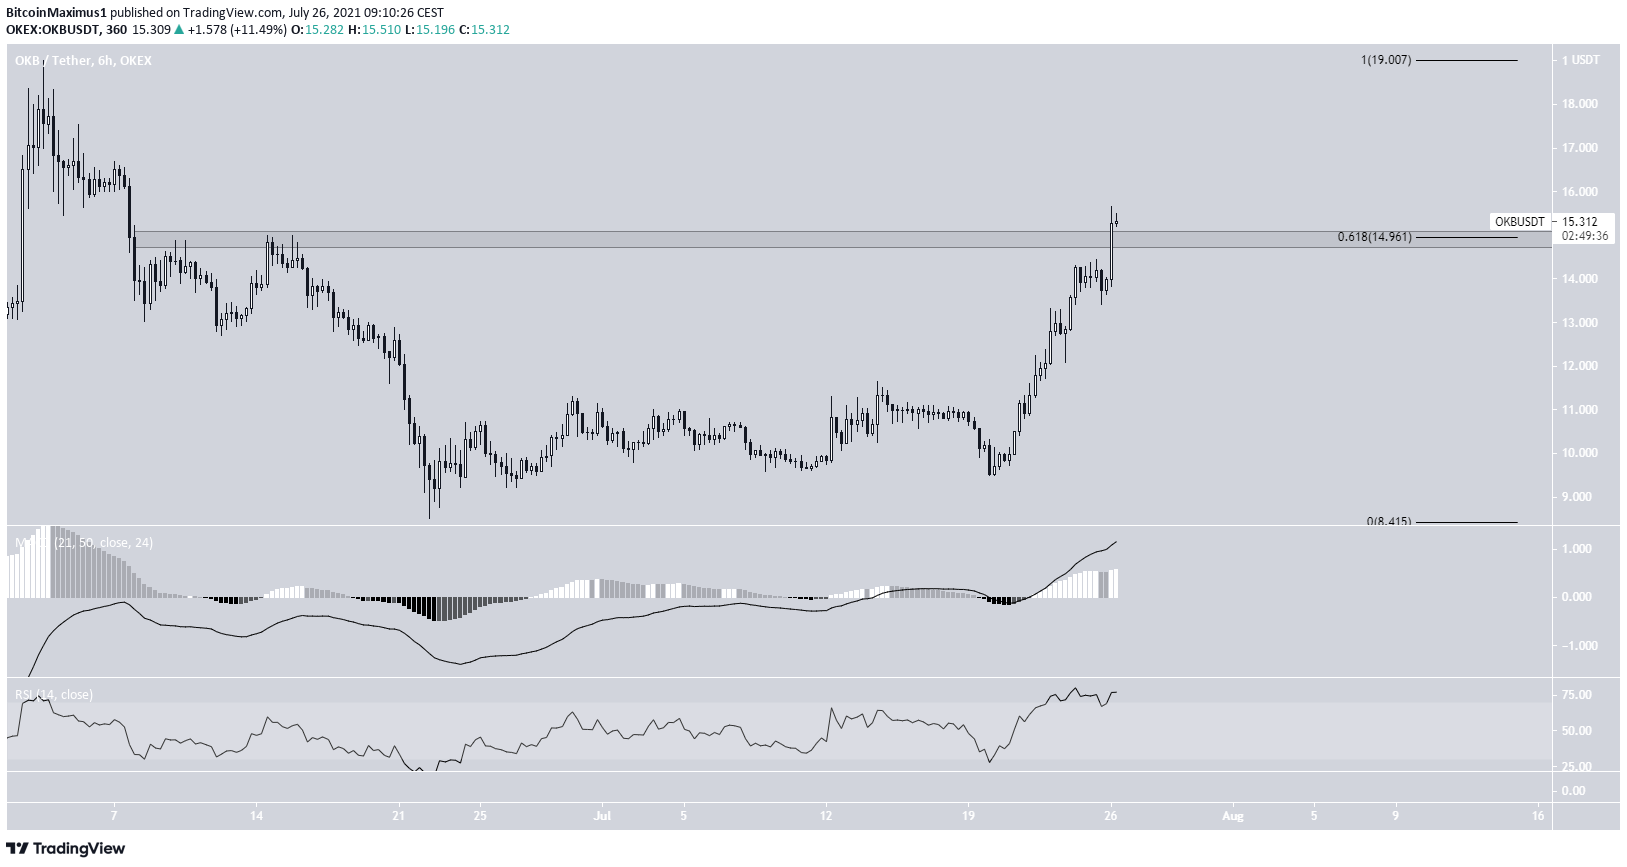
OKB
OKB has been moving upwards since June 22. On July 20, it created its first higher low and resumed its upward move at an accelerated rate.
It has just moved above the 0.618 Fib retracement resistance level at $14.96. This is also a long-term horizontal resistance area.
Successfully reclaiming this would likely trigger an upward movement toward $19.
For BeInCrypto’s latest bitcoin (BTC) analysis, click here.